
Where are the best places to live in the Midwest? They’re the places with strong economies, where people have good jobs, crime is low, and homes hold their value.
So we used Saturday Night Science to rank the 100 biggest cities in the 12 Midwest states on income, home values, jobs, poverty, education, health insurance, density, and crime.
The best city in the Midwest for 2026 is Fishers, IN. It’s a suburb-heavy list: Chicago, Indianapolis, Minneapolis-St. Paul, Detroit, St. Louis, and Des Moines all have winners on their outskirts. Minnesota leads the way with three cities in the top ten.
The worst of the 100? Dayton, OH. Ohio has three of the bottom five.
Fishers, just northeast of Indianapolis, is the best city in the Midwest. Its violent crime rate is one of the lowest in the region, the unemployment rate is 2.8%, and only 4% of residents live in poverty. The median household earns $130,203.
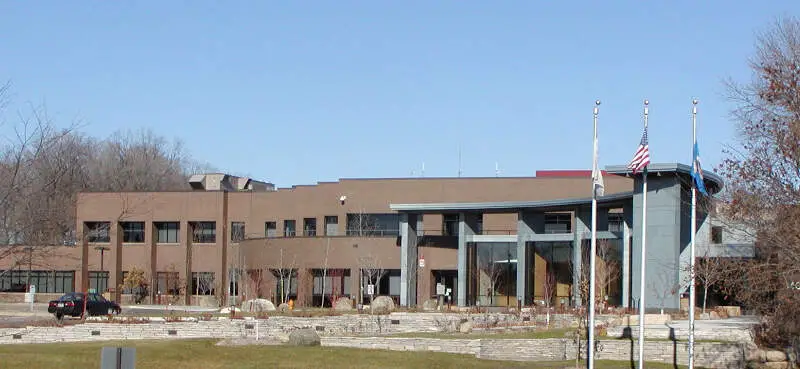
Plymouth is a Minneapolis suburb, and it’s the first of three Twin Cities suburbs in the top ten. It has the second-lowest violent crime rate on the list, a median household income of $136,534, and a median home value of $491,200.
Data | Crime | Cost of living
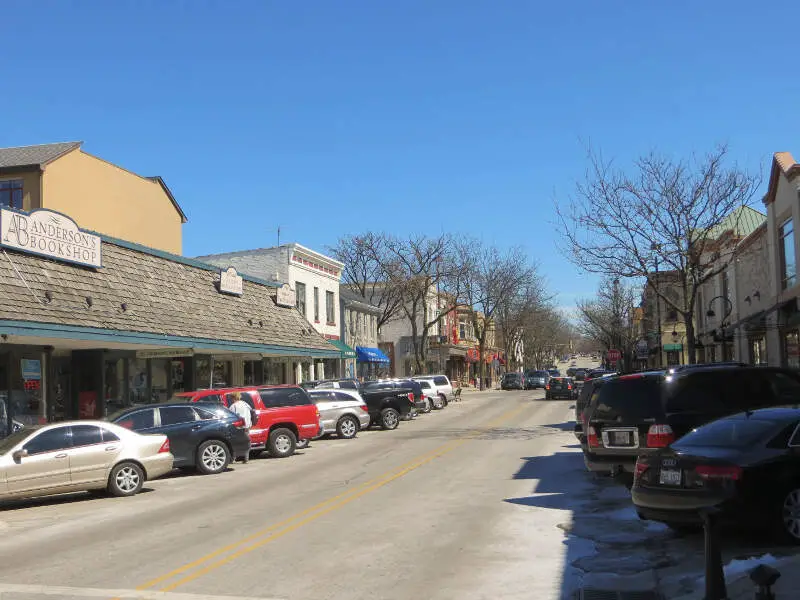
Naperville, about 30 miles west of Chicago, has the highest median household income in the top ten at $155,105, and the most expensive homes, with a median value of $540,200. It’s also the biggest city in the top ten, with more than 150,000 people.
Data | Crime | Cost of living
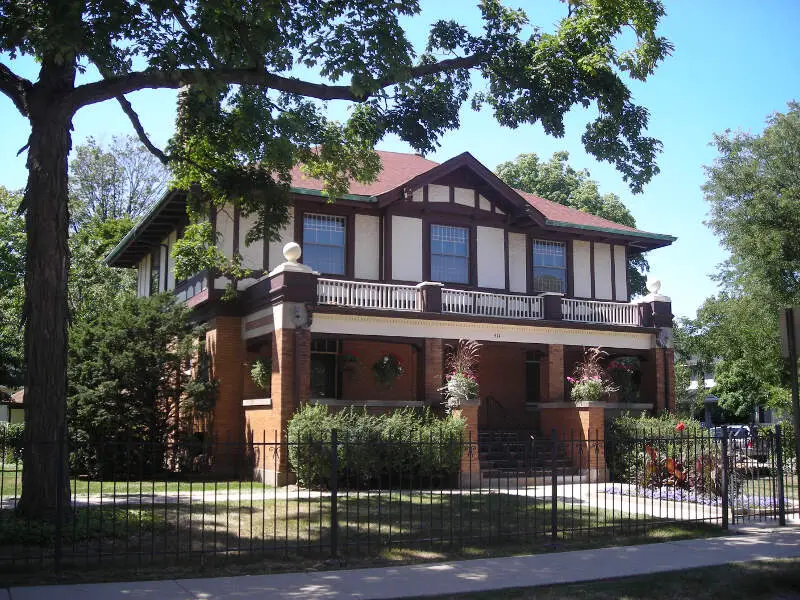
Arlington Heights is a northwest Chicago suburb with the lowest violent crime rate in the top ten. The median household earns $116,723, and just 3.5% of workers are unemployed.
Data | Crime | Cost of living
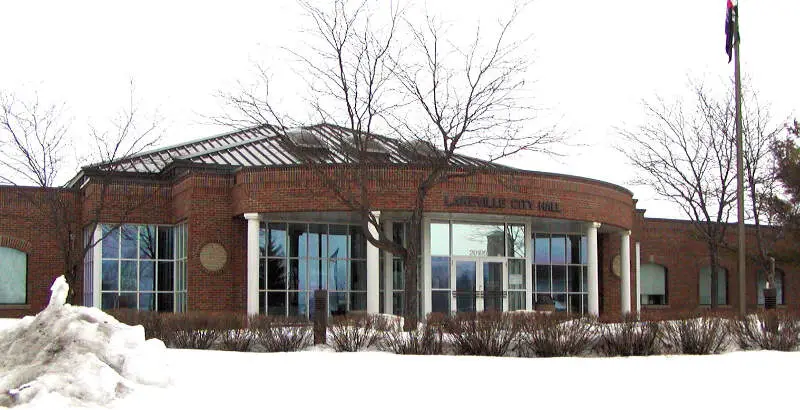
Lakeville, south of the Twin Cities, has the lowest poverty rate in the top ten (2.9%) and the second-lowest unemployment rate (2%). The median home is worth $452,500.
Data | Crime | Cost of living
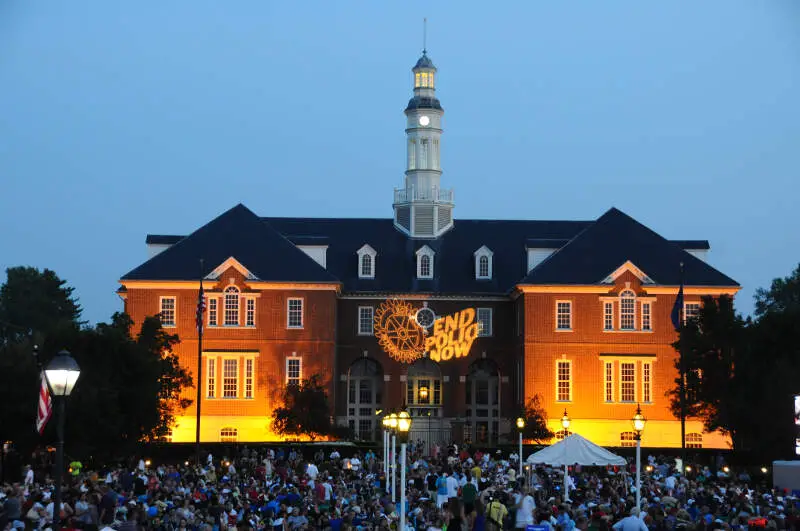
Carmel gives Indiana two cities in the top ten. This Indianapolis suburb is famous for its roundabouts, and the numbers are just as smooth: a median household income of $141,505, a 3.9% poverty rate, and a violent crime rate that’s among the lowest in the Midwest.
Data | Crime | Cost of living
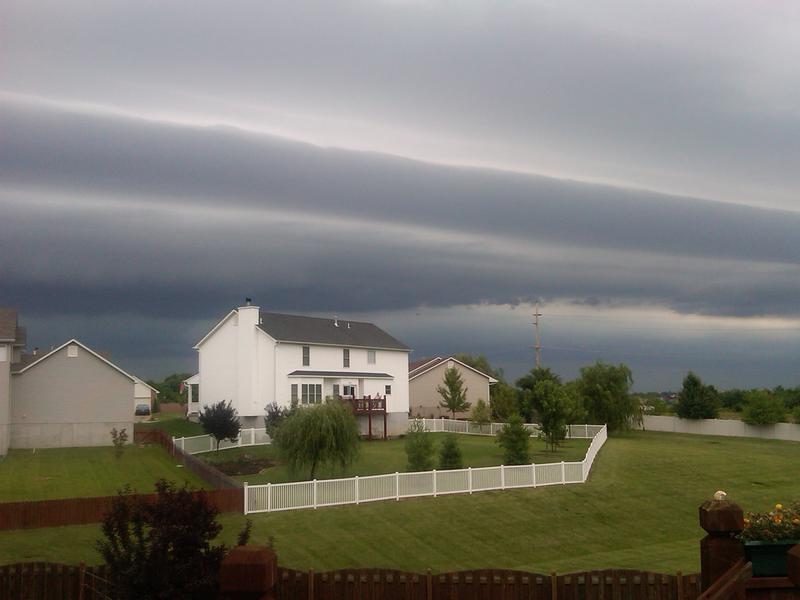
O’Fallon is the St. Louis area’s entry, about 30 miles west of downtown in St. Charles County. It has the lowest property crime rate in the top ten, and the median household earns $110,443. Homes are relatively affordable, too, with a median value of $326,200.
Data | Crime | Cost of living

Rochester Hills is the only Michigan city in the top ten. This Detroit suburb has a median household income of $120,694, just 2.9% of residents without health insurance, and a 5.2% poverty rate.
Data | Crime | Cost of living
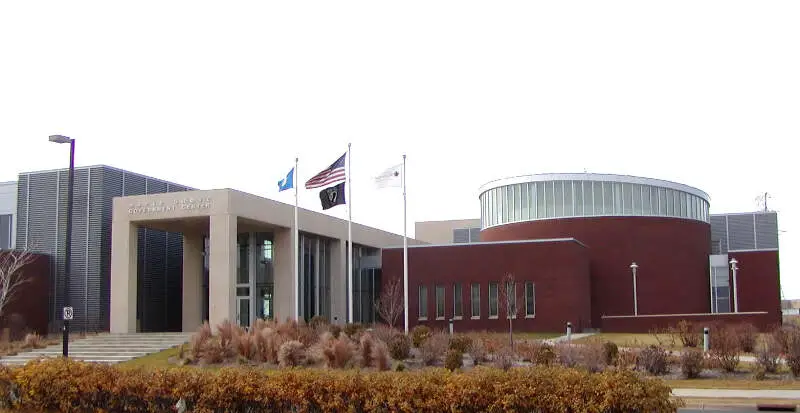
Maple Grove, northwest of Minneapolis, gives Minnesota its third city in the top ten. It has the lowest uninsured rate on the list at 2.3%, and the median household earns $132,731.
Data | Crime | Cost of living
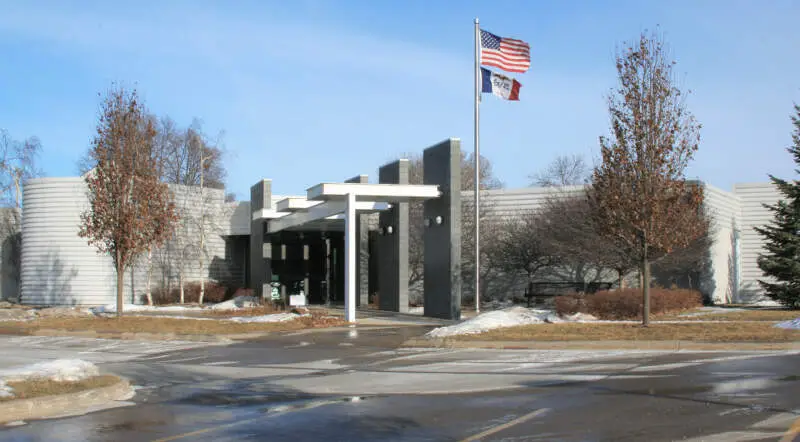
Ankeny, just north of Des Moines, rounds out the top ten. It has the lowest unemployment rate on the list at 1.9%, and the median home is worth $331,000 — the most affordable in the top ten except for O’Fallon.
Data | Crime | Cost of living
The receipts
Compare the top ten
Pick a metric. The bars rescale. The red line is the United States’s statewide median.
the United States statewide median: $80,734
the United States statewide median: $332,700
the United States statewide median: 12.5%
the United States statewide median: 5.2%
On the map
Where the best cities in the Midwest are
Saturday Night Science
Methodology: How We Determined The Best Cities In The Midwest
We looked at the 100 most populated cities in the Midwest — Illinois, Indiana, Iowa, Kansas, Michigan, Minnesota, Missouri, Nebraska, North Dakota, Ohio, South Dakota, and Wisconsin — and ranked each one on these nine criteria from the Census Bureau’s 2020-2024 American Community Survey and FBI crime data:
We averaged each city’s nine rankings, and the city with the best average earned the title “Best City In The Midwest.” A few cities are missing a number (Bloomington, IL has no crime data in the FBI file, and Fishers has no density figure), so they were scored on the criteria they do have.
- Median household income
- Median home value
- Unemployment rate
- Poverty rate
- Share of adults without a high school diploma
- Share of residents without health insurance
- Population density
- Violent crime per capita
- Property crime per capita
The data doesn’t measure things like friendly neighbors, good barbecue, or how pretty a place is in the fall. It measures the things people say they want when they’re picking a place to live.
We updated this report for 2026. This report is an opinion based on facts and is meant as infotainment — don’t freak out.
The full list
The 100 Best Midwest Cities, Ranked
Click any column to sort. Search by city name.
| Rank | City | Population | Median Income | Home Value | Unemployment | Poverty | Violent Crime /100k |
|---|---|---|---|---|---|---|---|
| 1 | Fishers, IN | 102,337 | $130,203 | $391,000 | 2.8% | 4.0% | 73 |
| 2 | Plymouth, MN | 79,220 | $136,534 | $491,200 | 2.3% | 4.3% | 51 |
| 3 | Naperville, IL | 150,692 | $155,105 | $540,200 | 4.5% | 4.4% | 84 |
| 4 | Arlington Heights, IL | 76,005 | $116,723 | $414,500 | 3.5% | 6.0% | 50 |
| 5 | Lakeville, MN | 74,354 | $139,041 | $452,500 | 2.0% | 2.9% | 76 |
| 6 | Carmel, IN | 101,651 | $141,505 | $486,800 | 2.7% | 3.9% | 66 |
| 7 | O’Fallon, MO | 93,801 | $110,443 | $326,200 | 2.7% | 5.4% | 59 |
| 8 | Rochester Hills, MI | 77,089 | $120,694 | $409,800 | 4.1% | 5.2% | 92 |
| 9 | Maple Grove, MN | 71,173 | $132,731 | $418,300 | 3.5% | 4.0% | 113 |
| 10 | Ankeny, IA | 72,615 | $108,198 | $331,000 | 1.9% | 4.2% | 166 |
| 11 | Woodbury, MN | 78,305 | $125,310 | $450,200 | 3.9% | 5.3% | 99 |
| 12 | Troy, MI | 87,898 | $120,045 | $420,300 | 4.4% | 5.4% | 116 |
| 13 | Schaumburg, IL | 76,868 | $97,514 | $330,400 | 3.5% | 5.7% | 91 |
| 14 | Overland Park, KS | 200,306 | $104,834 | $413,600 | 3.6% | 5.6% | 184 |
| 15 | Noblesville, IN | 73,362 | $104,047 | $349,700 | 2.9% | 5.3% | 84 |
| 16 | St. Charles, MO | 71,508 | $85,937 | $298,700 | 2.9% | 7.3% | 134 |
| 17 | Waukesha, WI | 71,233 | $83,837 | $315,500 | 2.7% | 9.8% | 114 |
| 18 | Farmington Hills, MI | 83,515 | $104,836 | $354,500 | 5.2% | 7.6% | 198 |
| 19 | Livonia, MI | 93,851 | $98,460 | $281,100 | 4.6% | 4.7% | 228 |
| 20 | Madison, WI | 278,001 | $78,050 | $372,900 | 2.7% | 16.4% | 256 |
| 21 | Ann Arbor, MI | 122,036 | $82,212 | $453,400 | 3.9% | 23.8% | 302 |
| 22 | Olathe, KS | 145,057 | $114,009 | $364,700 | 2.7% | 5.6% | 196 |
| 23 | Shawnee, KS | 68,542 | $109,940 | $359,700 | 3.3% | 5.3% | 277 |
| 24 | Blaine, MN | 72,488 | $106,801 | $352,400 | 4.2% | 7.2% | 89 |
| 25 | Evanston, IL | 76,340 | $96,434 | $481,200 | 6.2% | 11.8% | 142 |
| 26 | Lee’S Summit, MO | 103,656 | $102,531 | $340,900 | 3.8% | 5.7% | 149 |
| 27 | West Des Moines, IA | 71,083 | $86,594 | $309,000 | 2.4% | 8.4% | 165 |
| 28 | Rochester, MN | 122,330 | $89,389 | $310,500 | 3.7% | 8.5% | 154 |
| 29 | Appleton, WI | 75,023 | $80,483 | $231,400 | 3.5% | 8.3% | 202 |
| 30 | Bolingbrook, IL | 74,096 | $108,400 | $314,700 | 5.7% | 9.2% | 182 |
| 31 | Bismarck, ND | 75,556 | $78,387 | $300,300 | 2.5% | 9.3% | 278 |
| 32 | Bloomington, IL | 78,907 | $77,384 | $203,300 | 2.7% | 11.0% | |
| 33 | Eau Claire, WI | 70,322 | $67,395 | $247,600 | 3.4% | 14.3% | 162 |
| 34 | Kenosha, WI | 99,372 | $71,239 | $225,200 | 4.5% | 13.7% | 286 |
| 35 | Bloomington, MN | 88,665 | $93,211 | $361,700 | 4.8% | 9.2% | 312 |
| 36 | Brooklyn Park, MN | 83,876 | $89,891 | $336,200 | 4.0% | 9.5% | 291 |
| 37 | Sterling Heights, MI | 133,573 | $79,909 | $274,300 | 6.1% | 11.1% | 229 |
| 38 | Parma, OH | 79,870 | $69,295 | $170,100 | 6.5% | 10.1% | 119 |
| 39 | Lincoln, NE | 294,856 | $71,867 | $264,000 | 3.3% | 12.7% | 348 |
| 40 | Iowa City, IA | 75,752 | $58,546 | $285,900 | 4.6% | 26.3% | 321 |
| 41 | Aurora, IL | 179,898 | $93,633 | $274,800 | 5.8% | 9.5% | 266 |
| 42 | Southfield, MI | 76,236 | $68,166 | $236,200 | 6.9% | 10.3% | 493 |
| 43 | Cedar Rapids, IA | 137,264 | $70,424 | $187,100 | 3.6% | 10.8% | 262 |
| 44 | Wyoming, MI | 77,353 | $73,677 | $225,200 | 4.1% | 10.5% | 471 |
| 45 | Sioux Falls, SD | 201,469 | $75,970 | $292,400 | 2.5% | 9.6% | 527 |
| 46 | Minneapolis, MN | 427,246 | $80,846 | $362,200 | 5.9% | 16.0% | 1,160 |
| 47 | Elgin, IL | 114,934 | $90,282 | $273,000 | 6.1% | 9.8% | 267 |
| 48 | Joliet, IL | 150,445 | $92,201 | $265,800 | 5.5% | 11.1% | 350 |
| 49 | Columbia, MO | 128,548 | $66,498 | $284,600 | 4.0% | 19.3% | 348 |
| 50 | Fargo, ND | 131,627 | $66,998 | $281,900 | 3.8% | 12.9% | 498 |
| 51 | St. Paul, MN | 307,284 | $73,394 | $294,500 | 5.4% | 15.6% | 618 |
| 52 | Cicero, IL | 82,797 | $70,842 | $249,400 | 5.0% | 14.6% | 347 |
| 53 | Lawrence, KS | 96,051 | $65,009 | $292,700 | 4.4% | 17.4% | 462 |
| 54 | Duluth, MN | 87,093 | $68,807 | $242,700 | 4.7% | 16.8% | 219 |
| 55 | Westland, MI | 83,633 | $62,076 | $184,600 | 6.0% | 14.3% | 449 |
| 56 | Omaha, NE | 488,837 | $73,201 | $245,500 | 4.2% | 13.5% | 369 |
| 57 | Green Bay, WI | 106,253 | $66,206 | $207,200 | 3.7% | 14.7% | 495 |
| 58 | Champaign, IL | 89,996 | $56,118 | $210,900 | 4.8% | 25.9% | 502 |
| 59 | Bloomington, IN | 80,049 | $50,465 | $321,400 | 6.6% | 29.8% | 287 |
| 60 | Grand Rapids, MI | 198,535 | $69,108 | $244,500 | 5.2% | 16.9% | 910 |
| 61 | Rapid City, SD | 77,946 | $70,870 | $299,400 | 2.6% | 12.5% | 719 |
| 62 | Racine, WI | 77,633 | $57,740 | $166,500 | 6.1% | 18.2% | 383 |
| 63 | Dearborn, MI | 107,423 | $65,324 | $218,800 | 6.6% | 24.3% | 293 |
| 64 | Warren, MI | 137,928 | $64,016 | $193,400 | 8.0% | 14.8% | 542 |
| 65 | Chicago, IL | 2,711,226 | $77,902 | $334,100 | 8.0% | 16.8% | 540 |
| 66 | Columbus, OH | 914,802 | $66,082 | $252,900 | 5.1% | 18.1% | 435 |
| 67 | Waukegan, IL | 89,076 | $71,919 | $190,900 | 6.4% | 15.3% | 445 |
| 68 | Lafayette, IN | 71,159 | $53,716 | $172,800 | 3.6% | 17.8% | 600 |
| 69 | Fort Wayne, IN | 268,589 | $61,422 | $188,900 | 5.6% | 16.0% | 307 |
| 70 | Davenport, IA | 100,913 | $66,200 | $166,400 | 4.6% | 15.2% | 581 |
| 71 | Des Moines, IA | 212,421 | $65,932 | $194,700 | 5.6% | 15.0% | 703 |
| 72 | St. Cloud, MN | 70,629 | $61,374 | $225,000 | 6.0% | 20.2% | 408 |
| 73 | Wichita, KS | 397,945 | $64,620 | $190,800 | 5.6% | 15.9% | 539 |
| 74 | Springfield, IL | 113,330 | $66,064 | $162,100 | 6.8% | 16.8% | 901 |
| 75 | Indianapolis, IN | 885,860 | $66,219 | $224,800 | 5.1% | 15.8% | 878 |
| 76 | St. Louis, MO | 288,512 | $56,160 | $197,500 | 5.0% | 20.6% | 1,367 |
| 77 | Kansas City, MO | 510,612 | $69,166 | $242,900 | 4.4% | 14.6% | 1,547 |
| 78 | Cincinnati, OH | 311,224 | $52,909 | $230,900 | 6.8% | 25.5% | 846 |
| 79 | Sioux City, IA | 86,101 | $68,906 | $173,600 | 4.5% | 15.3% | 555 |
| 80 | Toledo, OH | 267,463 | $49,724 | $114,500 | 7.7% | 24.3% | 1,041 |
| 81 | Topeka, KS | 125,786 | $56,956 | $144,200 | 4.9% | 15.7% | 857 |
| 82 | Kalamazoo, MI | 73,076 | $52,272 | $179,000 | 6.9% | 24.9% | 1,284 |
| 83 | Lansing, MI | 113,023 | $54,382 | $128,700 | 8.2% | 20.1% | 1,345 |
| 84 | Decatur, IL | 69,815 | $51,592 | $99,600 | 8.3% | 19.4% | 602 |
| 85 | Milwaukee, WI | 566,973 | $54,234 | $184,000 | 6.2% | 22.8% | 1,431 |
| 86 | Evansville, IN | 116,116 | $53,387 | $143,100 | 5.1% | 18.4% | 1,206 |
| 87 | Flint, MI | 80,175 | $37,646 | $53,500 | 14.8% | 34.1% | 1,258 |
| 88 | South Bend, IN | 103,085 | $55,786 | $140,400 | 6.5% | 20.8% | 965 |
| 89 | Springfield, MO | 169,954 | $49,311 | $177,700 | 4.3% | 18.4% | 1,178 |
| 90 | Independence, MO | 121,740 | $60,339 | $172,900 | 5.6% | 15.8% | 571 |
| 91 | Peoria, IL | 112,169 | $59,410 | $156,200 | 7.5% | 21.0% | 1,345 |
| 92 | Hammond, IN | 76,768 | $55,504 | $159,900 | 6.5% | 19.1% | 741 |
| 93 | St. Joseph, MO | 71,236 | $57,956 | $154,200 | 4.3% | 17.7% | 729 |
| 94 | Akron, OH | 189,247 | $48,076 | $122,000 | 7.8% | 23.3% | 820 |
| 95 | Rockford, IL | 147,521 | $54,752 | $129,000 | 8.5% | 21.3% | 1,080 |
| 96 | Kansas City, KS | 155,135 | $62,401 | $167,400 | 5.8% | 16.0% | 1,047 |
| 97 | Detroit, MI | 638,530 | $39,938 | $83,900 | 14.0% | 32.7% | 1,781 |
| 98 | Cleveland, OH | 366,097 | $40,801 | $102,000 | 10.8% | 30.6% | 1,561 |
| 99 | Canton, OH | 69,755 | $43,188 | $97,800 | 7.8% | 27.4% | 1,122 |
| 100 | Dayton, OH | 136,579 | $45,247 | $100,600 | 9.0% | 26.9% | 1,339 |
Source: U.S. Census Bureau American Community Survey 2020-2024; FBI crime data. The 100 largest cities in the 12 Midwest states.
Summary
Summary: The Best Places To Live In The Midwest
If you’re looking at the largest cities in the Midwest where crime is low, people are doing well financially, and almost everyone has a job, this is an accurate list.
The best cities in the Midwest for 2026 are Fishers, IN, Plymouth, MN, Naperville, IL, Arlington Heights, IL, Lakeville, MN, Carmel, IN, O’Fallon, MO, Rochester Hills, MI, Maple Grove, MN, and Ankeny, IA.
Every one of the top ten has a median household income over $100,000 and a poverty rate of about 6% or less. The big core cities — Detroit, Cleveland, Kansas City — sit at the other end of the list.
Questions and answers
Best Midwest Cities FAQs
What is the best city to live in the Midwest?
Fishers, IN is the best city to live in the Midwest for 2026, according to Saturday Night Science. Plymouth and Naperville are next.
What are the 10 best Midwest cities?
The ten best cities in the Midwest for 2026 are Fishers, IN, Plymouth, MN, Naperville, IL, Arlington Heights, IL, Lakeville, MN, Carmel, IN, O’Fallon, MO, Rochester Hills, MI, Maple Grove, MN, and Ankeny, IA.
What is the worst city in the Midwest?
Dayton, OH ranks last among the 100 biggest cities in the Midwest.
Which states count as the Midwest?
We used the Census Bureau’s 12 Midwest states: Illinois, Indiana, Iowa, Kansas, Michigan, Minnesota, Missouri, Nebraska, North Dakota, Ohio, South Dakota, and Wisconsin.