Rochester SnackAbility
Overall SnackAbility
Crime in Rochester summary. We use data from the FBI to determine the crime rates in Rochester. Key points include:
There were 2,141 total crimes in Rochester in the last reporting year.
The overall crime rate per 100,000 people in Rochester is 1,754.4 / 100k people.
The violent crime rate per 100,000 people in Rochester is 162.2 / 100k people.
The property crime rate per 100,000 people in Rochester is 1,592.2 / 100k people.
Overall, crime in Rochester is -17.21% below the national average.
Total Crimes
Below National Average
Crime In Rochester Comparison Table
| Statistic | Count Raw |
Rochester / 100k People |
Minnesota / 100k People |
National / 100k People |
|---|---|---|---|---|
| Total Crimes Per 100K | 2,141 | 1,754.4 | 1,862.9 | 2,119.2 |
| Violent Crime | 198 | 162.2 | 256.6 | 359.0 |
| Murder | 1 | 0.8 | 2.9 | 5.0 |
| Robbery | 28 | 22.9 | 48.9 | 61.0 |
| Aggravated Assault | 125 | 102.4 | 168.0 | 256.0 |
| Property Crime | 1,943 | 1,592.2 | 1,606.3 | 1,760.0 |
| Burglary | 223 | 182.7 | 184.7 | 229.0 |
| Larceny | 1,566 | 1,283.2 | 1,208.5 | 1,272.0 |
| Car Theft | 154 | 126.2 | 213.1 | 259.0 |
Source: FBI Uniform Crime Reporting (2024)
Cost of living in Rochester summary. We use data on the cost of living to determine how expensive it is to live in Rochester. Real estate prices drive most of the variance in cost of living around Minnesota. Key points include:
The cost of living in Rochester is 108 with 100 being average.
The cost of living in Rochester is 1.1x higher than the national average.
The median home value in Rochester is $339,454.
The median income in Rochester is $89,389.
Rochester's Overall Cost Of Living
Higher Than The National Average
Cost Of Living In Rochester Comparison Table
| Living Expense | Rochester | Minnesota | National Average |
|---|---|---|---|
| Overall | 108 | 101 | 100 |
| Services | 100 | 101 | 100 |
| Groceries | 100 | 99 | 100 |
| Health | 117 | 99 | 100 |
| Housing | 102 | 101 | 100 |
| Transportation | 108 | 103 | 100 |
| Utilities | 97 | 101 | 100 |
Source: Cost of living index, normalized to US average = 100
Rochester, MN Weather
The average high in Rochester is 54.5° and the average low is 35.0°.
There are 62.2 days of precipitation each year.
Expect an average of 33.5 inches of precipitation each year with 49.1 inches of snow.
| Stat | Rochester |
|---|---|
| Average Annual High | 54.5 |
| Average Annual Low | 35.0 |
| Annual Precipitation Days | 62.2 |
| Average Annual Precipitation | 33.5 |
| Average Annual Snowfall | 49.1 |
Average High
Days of Rain
Source: NOAA climate normals (30-year)
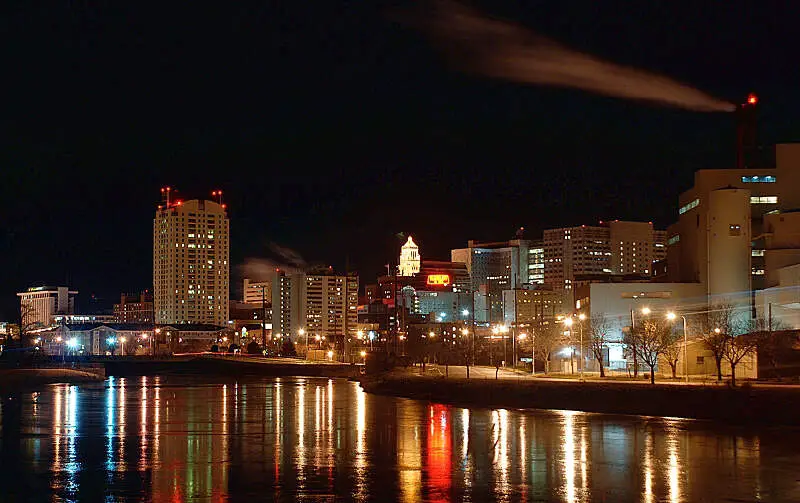
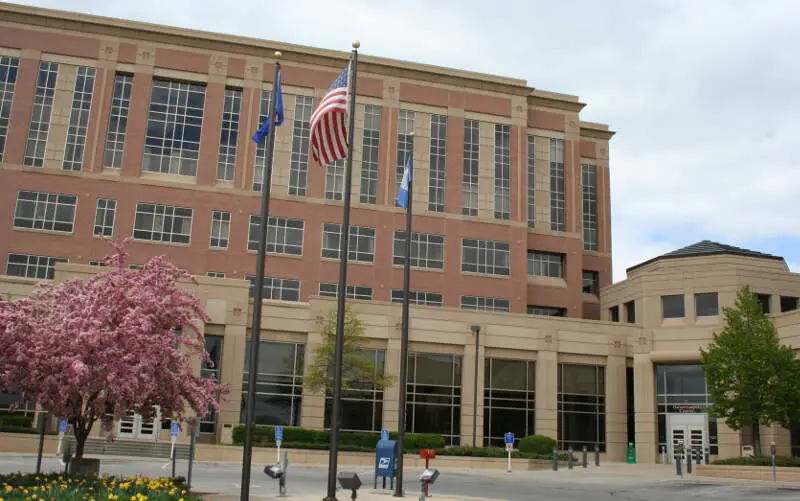
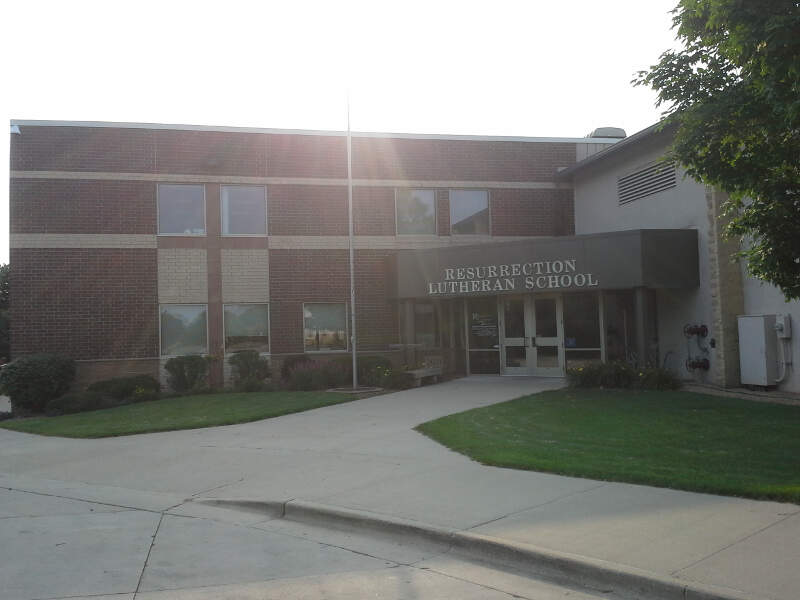
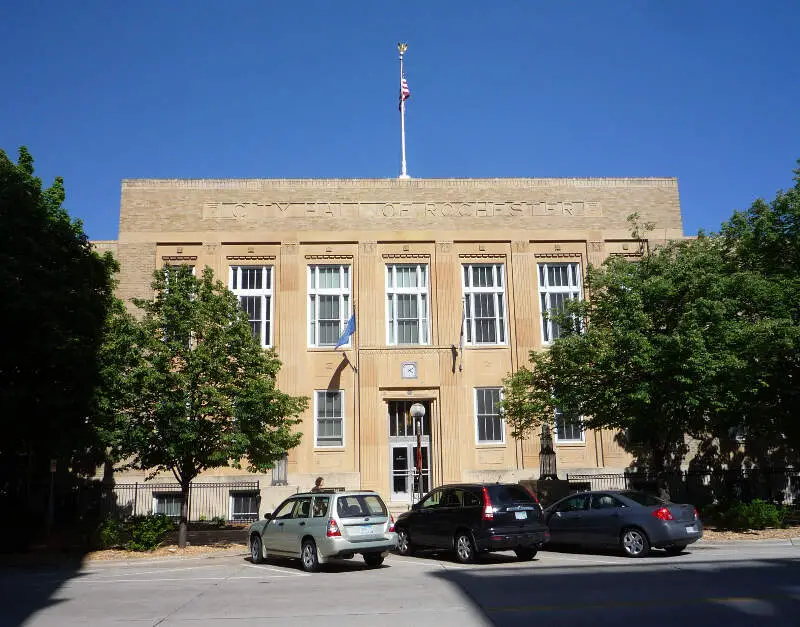
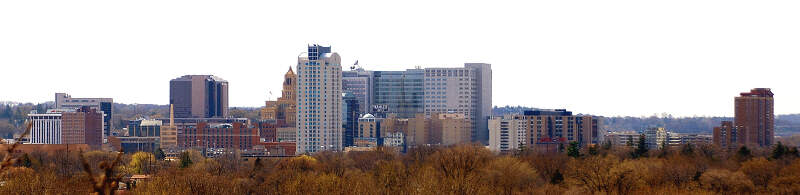
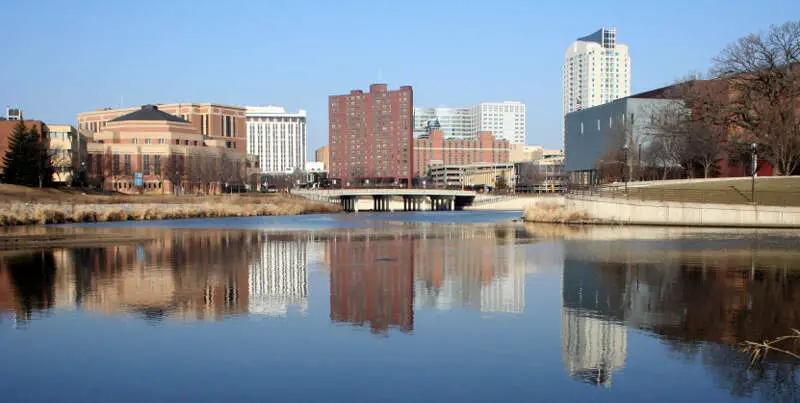
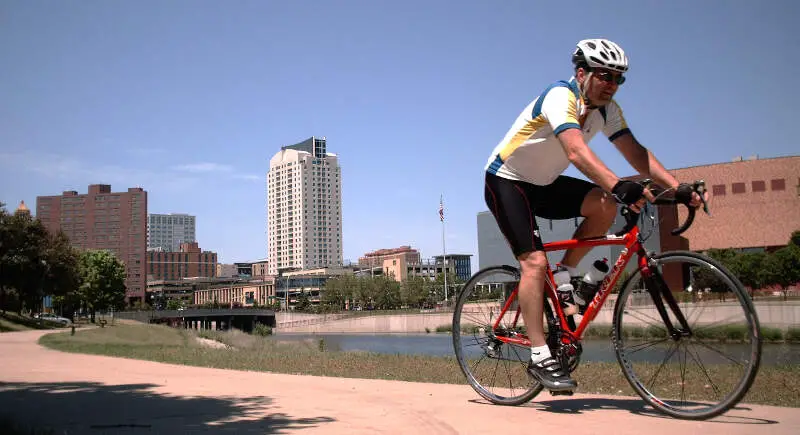
Rochester, MN Photos

Rankings & Articles For Rochester


Locations Around Rochester
Map Of Rochester, MN
Best Places Around Rochester
Stewartville, MN
Population 6,807
Kasson, MN
Population 7,050
Owatonna, MN
Population 26,498
Northfield, MN
Population 20,742
Winona, MN
Population 26,009
Austin, MN
Population 26,358
Faribault, MN
Population 24,631
Red Wing, MN
Population 16,758
Rochester Demographics And Statistics
Population over time in Rochester
The current population in Rochester is 122,330. The population has increased 17.4% from 2010.
| Year | Population | % Change |
|---|---|---|
| 2024 | 122,330 | 0.6% |
| 2023 | 121,638 | 0.7% |
| 2022 | 120,848 | 0.9% |
| 2021 | 119,732 | 2.2% |
| 2020 | 117,134 | 1.4% |
| 2019 | 115,557 | 1.4% |
| 2018 | 113,913 | 1.1% |
| 2017 | 112,683 | 1.2% |
| 2016 | 111,396 | 1.0% |
| 2015 | 110,275 | 0.9% |
| 2014 | 109,252 | 1.0% |
| 2013 | 108,179 | 1.2% |
| 2012 | 106,903 | 1.3% |
| 2011 | 105,576 | 1.3% |
| 2010 | 104,201 | - |
Race / Ethnicity in Rochester
See the full breakdown
Rochester is:
70.6% White with 86,372 White residents.
9.8% African American with 11,957 African American residents.
0.1% American Indian with 153 American Indian residents.
7.8% Asian with 9,498 Asian residents.
0.0% Hawaiian with 0 Hawaiian residents.
0.4% Other with 537 Other residents.
4.7% Two Or More with 5,793 Two Or More residents.
6.6% Hispanic with 8,020 Hispanic residents.
| Race | Rochester | MN | USA |
|---|---|---|---|
| White | 70.6% | 75.9% | 57.4% |
| African American | 9.8% | 6.9% | 11.9% |
| American Indian | 0.1% | 0.7% | 0.5% |
| Asian | 7.8% | 5.1% | 5.9% |
| Hawaiian | 0.0% | 0.0% | 0.2% |
| Other | 0.4% | 0.5% | 0.6% |
| Two Or More | 4.7% | 4.5% | 4.3% |
| Hispanic | 6.6% | 6.4% | 19.3% |
Gender in Rochester
See the full breakdown
Rochester is 51.8% female with 63,310 female residents.
Rochester is 48.2% male with 59,020 male residents.
| Gender | Rochester | MN | USA |
|---|---|---|---|
| Female | 51.8% | 49.9% | 50.5% |
| Male | 48.2% | 50.1% | 49.5% |
Highest level of educational attainment in Rochester for adults over 25
See the full breakdown
3.0% of adults in Rochester completed < 9th grade.
2.0% of adults in Rochester completed 9-12th grade.
18.0% of adults in Rochester completed high school / ged.
15.0% of adults in Rochester completed some college.
11.0% of adults in Rochester completed associate's degree.
29.0% of adults in Rochester completed bachelor's degree.
13.0% of adults in Rochester completed master's degree.
5.0% of adults in Rochester completed professional degree.
4.0% of adults in Rochester completed doctorate degree.
| Education | Rochester | MN | USA |
|---|---|---|---|
| < 9th Grade | 3.0% | 3.0% | 4.0% |
| 9-12th Grade | 2.0% | 3.0% | 6.0% |
| High School / GED | 18.0% | 23.0% | 26.0% |
| Some College | 15.0% | 19.0% | 19.0% |
| Associate's Degree | 11.0% | 12.0% | 9.0% |
| Bachelor's Degree | 29.0% | 26.0% | 22.0% |
| Master's Degree | 13.0% | 10.0% | 10.0% |
| Professional Degree | 5.0% | 2.0% | 2.0% |
| Doctorate Degree | 4.0% | 2.0% | 2.0% |
Household Income For Rochester, Minnesota
See the full breakdown
3.1% of households in Rochester earn Less than $10,000.
1.9% of households in Rochester earn $10,000 to $14,999.
5.4% of households in Rochester earn $15,000 to $24,999.
5.4% of households in Rochester earn $25,000 to $34,999.
8.8% of households in Rochester earn $35,000 to $49,999.
16.8% of households in Rochester earn $50,000 to $74,999.
13.4% of households in Rochester earn $75,000 to $99,999.
19.6% of households in Rochester earn $100,000 to $149,999.
10.6% of households in Rochester earn $150,000 to $199,999.
15.0% of households in Rochester earn $200,000 or more.
| Income | Rochester | MN | USA |
|---|---|---|---|
| Less than $10,000 | 3.1% | 3.8% | 5.0% |
| $10,000 to $14,999 | 1.9% | 2.7% | 3.4% |
| $15,000 to $24,999 | 5.4% | 5.2% | 6.3% |
| $25,000 to $34,999 | 5.4% | 5.6% | 6.6% |
| $35,000 to $49,999 | 8.8% | 9.3% | 10.1% |
| $50,000 to $74,999 | 16.8% | 15.6% | 15.5% |
| $75,000 to $99,999 | 13.4% | 13.2% | 12.6% |
| $100,000 to $149,999 | 19.6% | 19.6% | 17.5% |
| $150,000 to $199,999 | 10.6% | 11.2% | 9.6% |
| $200,000 or more | 15.0% | 13.8% | 13.4% |
Source: U.S. Census ACS 5-year estimates (2024)


