Compare Anchorage to…
Anchorage SnackAbility
Overall SnackAbility
Crime in Anchorage summary. We use data from the FBI to determine the crime rates in Anchorage. Key points include:
There were 10,849 total crimes in Anchorage in the last reporting year.
The overall crime rate per 100,000 people in Anchorage is 3,780.7 / 100k people.
The violent crime rate per 100,000 people in Anchorage is 1,014.8 / 100k people.
The property crime rate per 100,000 people in Anchorage is 2,765.9 / 100k people.
Overall, crime in Anchorage is 78.40% above the national average.
Total Crimes
Above National Average
Crime In Anchorage Comparison Table
| Statistic | Count Raw |
Anchorage / 100k People |
Alaska / 100k People |
National / 100k People |
|---|---|---|---|---|
| Total Crimes Per 100K | 10,849 | 3,780.7 | 2,435.2 | 2,119.2 |
| Violent Crime | 2,912 | 1,014.8 | 724.1 | 359.0 |
| Murder | 27 | 9.4 | 6.9 | 5.0 |
| Robbery | 479 | 166.9 | 82.0 | 61.0 |
| Aggravated Assault | 1,944 | 677.5 | 513.0 | 256.0 |
| Property Crime | 7,937 | 2,765.9 | 1,711.2 | 1,760.0 |
| Burglary | 910 | 317.1 | 238.2 | 229.0 |
| Larceny | 5,813 | 2,025.7 | 1,227.3 | 1,272.0 |
| Car Theft | 1,214 | 423.1 | 245.6 | 259.0 |
Source: FBI Uniform Crime Reporting (2024)
Cost of living in Anchorage summary. We use data on the cost of living to determine how expensive it is to live in Anchorage. Real estate prices drive most of the variance in cost of living around Alaska. Key points include:
The cost of living in Anchorage is 130 with 100 being average.
The cost of living in Anchorage is 1.3x higher than the national average.
The median home value in Anchorage is $410,782.
The median income in Anchorage is $103,284.
Anchorage's Overall Cost Of Living
Higher Than The National Average
Cost Of Living In Anchorage Comparison Table
| Living Expense | Anchorage | Alaska | National Average |
|---|---|---|---|
| Overall | 130 | 122 | 100 |
| Services | 125 | 117 | 100 |
| Groceries | 113 | 112 | 100 |
| Health | 166 | 137 | 100 |
| Housing | 114 | 113 | 100 |
| Transportation | 124 | 125 | 100 |
| Utilities | 124 | 116 | 100 |
Source: Cost of living index, normalized to US average = 100
Anchorage, AK Weather
The average high in Anchorage is 41.9° and the average low is 27.0°.
There are 49.7 days of precipitation each year.
Expect an average of 19.1 inches of precipitation each year with 93.3 inches of snow.
| Stat | Anchorage |
|---|---|
| Average Annual High | 41.9 |
| Average Annual Low | 27.0 |
| Annual Precipitation Days | 49.7 |
| Average Annual Precipitation | 19.1 |
| Average Annual Snowfall | 93.3 |
Average High
Days of Rain
Source: NOAA climate normals (30-year)
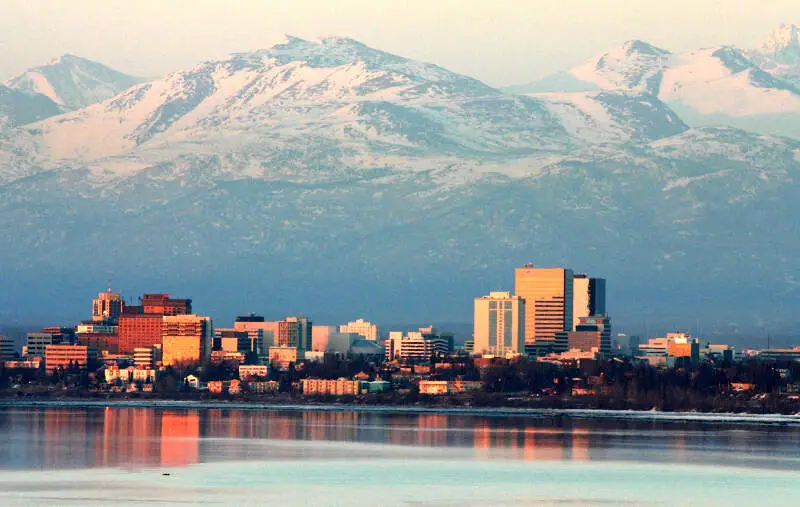
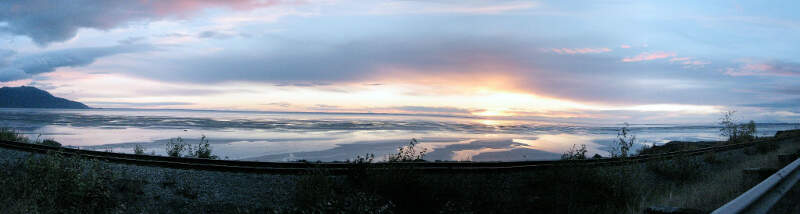
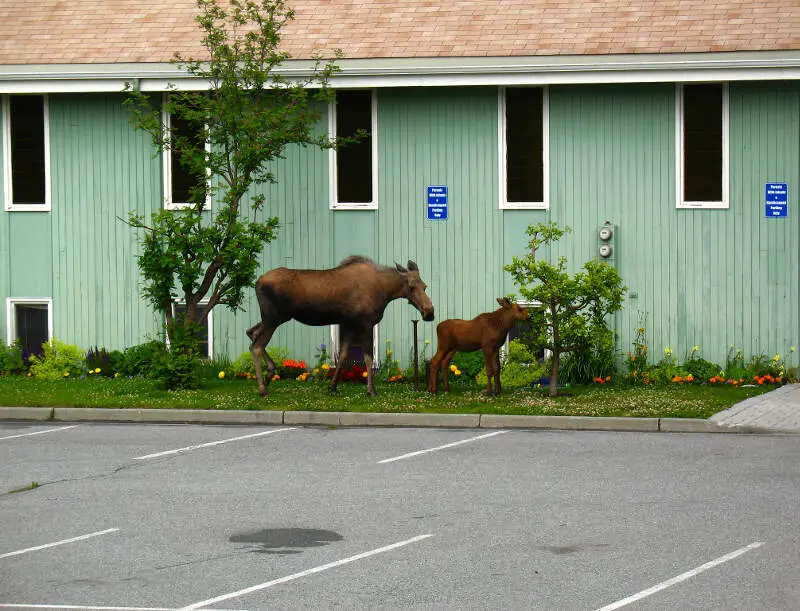
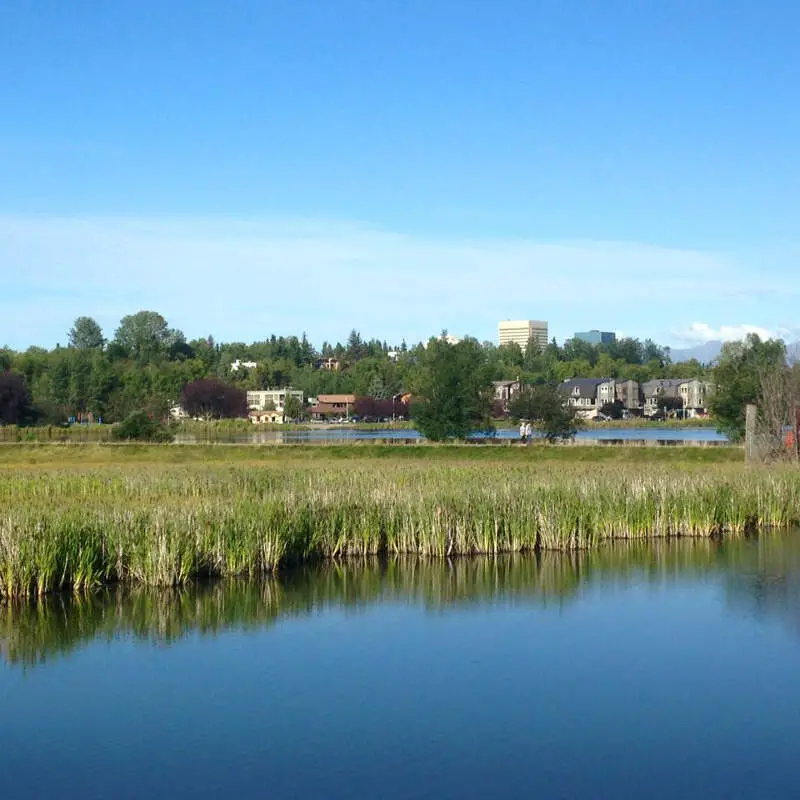
Anchorage, AK Photos


2 Reviews & Comments About Anchorage

It's known place for its diverse terrain of open spaces, mountains and forests, with abundant wildlife and many small towns. It's a destination for outdoor activities like skiing, mountain biking and kayaking. I had a great experience at there.
Very good experience.
Loved it in Anchorage, we lived just about a mile in from the ocean and about half a mile to the base of the mountains and start going up. The view was fantastic. In the winter we would get lots of snow and go snow skiing and snowmobile riding. In the summer we did a lot of fishing and hunting.
The winter was the best time of the year because of all the snow. My family and I would go to the ski resort almost every weekend and go skiing. I had a snowmobile so everyday after school I would jump on my snowmobile and go riding with my friends.
Rankings & Articles For Anchorage


Locations Around Anchorage
Map Of Anchorage, AK
Best Places Around Anchorage
Anchorage Demographics And Statistics
Population over time in Anchorage
The current population in Anchorage is 288,976. The population has increased 1.7% from 2010.
| Year | Population | % Change |
|---|---|---|
| 2024 | 288,976 | -0.0% |
| 2023 | 289,069 | -0.6% |
| 2022 | 290,674 | -0.6% |
| 2021 | 292,545 | 0.2% |
| 2020 | 292,090 | -0.5% |
| 2019 | 293,531 | -0.9% |
| 2018 | 296,112 | -0.7% |
| 2017 | 298,225 | -0.4% |
| 2016 | 299,321 | 0.1% |
| 2015 | 299,107 | 0.3% |
| 2014 | 298,178 | 1.0% |
| 2013 | 295,237 | 1.3% |
| 2012 | 291,470 | 1.4% |
| 2011 | 287,390 | 1.1% |
| 2010 | 284,267 | - |
Race / Ethnicity in Anchorage
See the full breakdown
Anchorage is:
54.2% White with 156,623 White residents.
4.8% African American with 13,941 African American residents.
7.0% American Indian with 20,177 American Indian residents.
9.8% Asian with 28,310 Asian residents.
3.1% Hawaiian with 8,885 Hawaiian residents.
0.9% Other with 2,636 Other residents.
10.7% Two Or More with 30,959 Two Or More residents.
9.5% Hispanic with 27,445 Hispanic residents.
| Race | Anchorage | AK | USA |
|---|---|---|---|
| White | 54.2% | 57.7% | 57.4% |
| African American | 4.8% | 2.9% | 11.9% |
| American Indian | 7.0% | 13.2% | 0.5% |
| Asian | 9.8% | 6.4% | 5.9% |
| Hawaiian | 3.1% | 1.5% | 0.2% |
| Other | 0.9% | 0.7% | 0.6% |
| Two Or More | 10.7% | 10.3% | 4.3% |
| Hispanic | 9.5% | 7.3% | 19.3% |
Gender in Anchorage
See the full breakdown
Anchorage is 48.9% female with 141,337 female residents.
Anchorage is 51.1% male with 147,639 male residents.
| Gender | Anchorage | AK | USA |
|---|---|---|---|
| Female | 48.9% | 47.5% | 50.5% |
| Male | 51.1% | 52.5% | 49.5% |
Highest level of educational attainment in Anchorage for adults over 25
See the full breakdown
2.0% of adults in Anchorage completed < 9th grade.
4.0% of adults in Anchorage completed 9-12th grade.
24.0% of adults in Anchorage completed high school / ged.
23.0% of adults in Anchorage completed some college.
8.0% of adults in Anchorage completed associate's degree.
24.0% of adults in Anchorage completed bachelor's degree.
10.0% of adults in Anchorage completed master's degree.
3.0% of adults in Anchorage completed professional degree.
2.0% of adults in Anchorage completed doctorate degree.
| Education | Anchorage | AK | USA |
|---|---|---|---|
| < 9th Grade | 2.0% | 1.0% | 4.0% |
| 9-12th Grade | 4.0% | 5.0% | 6.0% |
| High School / GED | 24.0% | 29.0% | 26.0% |
| Some College | 23.0% | 24.0% | 19.0% |
| Associate's Degree | 8.0% | 9.0% | 9.0% |
| Bachelor's Degree | 24.0% | 20.0% | 22.0% |
| Master's Degree | 10.0% | 9.0% | 10.0% |
| Professional Degree | 3.0% | 2.0% | 2.0% |
| Doctorate Degree | 2.0% | 1.0% | 2.0% |
Household Income For Anchorage, Alaska
See the full breakdown
3.2% of households in Anchorage earn Less than $10,000.
1.6% of households in Anchorage earn $10,000 to $14,999.
4.7% of households in Anchorage earn $15,000 to $24,999.
4.5% of households in Anchorage earn $25,000 to $34,999.
7.8% of households in Anchorage earn $35,000 to $49,999.
13.1% of households in Anchorage earn $50,000 to $74,999.
13.7% of households in Anchorage earn $75,000 to $99,999.
20.2% of households in Anchorage earn $100,000 to $149,999.
13.1% of households in Anchorage earn $150,000 to $199,999.
18.1% of households in Anchorage earn $200,000 or more.
| Income | Anchorage | AK | USA |
|---|---|---|---|
| Less than $10,000 | 3.2% | 3.7% | 5.0% |
| $10,000 to $14,999 | 1.6% | 2.1% | 3.4% |
| $15,000 to $24,999 | 4.7% | 5.4% | 6.3% |
| $25,000 to $34,999 | 4.5% | 4.9% | 6.6% |
| $35,000 to $49,999 | 7.8% | 8.9% | 10.1% |
| $50,000 to $74,999 | 13.1% | 14.7% | 15.5% |
| $75,000 to $99,999 | 13.7% | 13.6% | 12.6% |
| $100,000 to $149,999 | 20.2% | 19.9% | 17.5% |
| $150,000 to $199,999 | 13.1% | 12.0% | 9.6% |
| $200,000 or more | 18.1% | 14.6% | 13.4% |
Source: U.S. Census ACS 5-year estimates (2024)


