Ketchikan SnackAbility
Overall SnackAbility
Crime in Ketchikan summary. We use data from the FBI to determine the crime rates in Ketchikan. Key points include:
There were 193 total crimes in Ketchikan in the last reporting year.
The overall crime rate per 100,000 people in Ketchikan is 2,397.5 / 100k people.
The violent crime rate per 100,000 people in Ketchikan is 360.2 / 100k people.
The property crime rate per 100,000 people in Ketchikan is 2,037.3 / 100k people.
Overall, crime in Ketchikan is 13.13% above the national average.
Total Crimes
Above National Average
Crime In Ketchikan Comparison Table
| Statistic | Count Raw |
Ketchikan / 100k People |
Alaska / 100k People |
National / 100k People |
|---|---|---|---|---|
| Total Crimes Per 100K | 193 | 2,397.5 | 2,435.2 | 2,119.2 |
| Violent Crime | 29 | 360.2 | 724.1 | 359.0 |
| Murder | 0 | 0.0 | 6.9 | 5.0 |
| Robbery | 5 | 62.1 | 82.0 | 61.0 |
| Aggravated Assault | 21 | 260.9 | 513.0 | 256.0 |
| Property Crime | 164 | 2,037.3 | 1,711.2 | 1,760.0 |
| Burglary | 7 | 87.0 | 238.2 | 229.0 |
| Larceny | 157 | 1,950.3 | 1,227.3 | 1,272.0 |
| Car Theft | 0 | 0.0 | 245.6 | 259.0 |
Source: FBI Uniform Crime Reporting (2024)
Cost of living in Ketchikan summary. We use data on the cost of living to determine how expensive it is to live in Ketchikan. Real estate prices drive most of the variance in cost of living around Alaska. Key points include:
The cost of living in Ketchikan is 118 with 100 being average.
The cost of living in Ketchikan is 1.2x higher than the national average.
The median home value in Ketchikan is $397,250.
The median income in Ketchikan is $85,275.
Ketchikan's Overall Cost Of Living
Higher Than The National Average
Cost Of Living In Ketchikan Comparison Table
| Living Expense | Ketchikan | Alaska | National Average |
|---|---|---|---|
| Overall | 118 | 122 | 100 |
| Services | 118 | 117 | 100 |
| Groceries | 111 | 112 | 100 |
| Health | 135 | 137 | 100 |
| Housing | 115 | 113 | 100 |
| Transportation | 125 | 125 | 100 |
| Utilities | 115 | 116 | 100 |
Source: Cost of living index, normalized to US average = 100
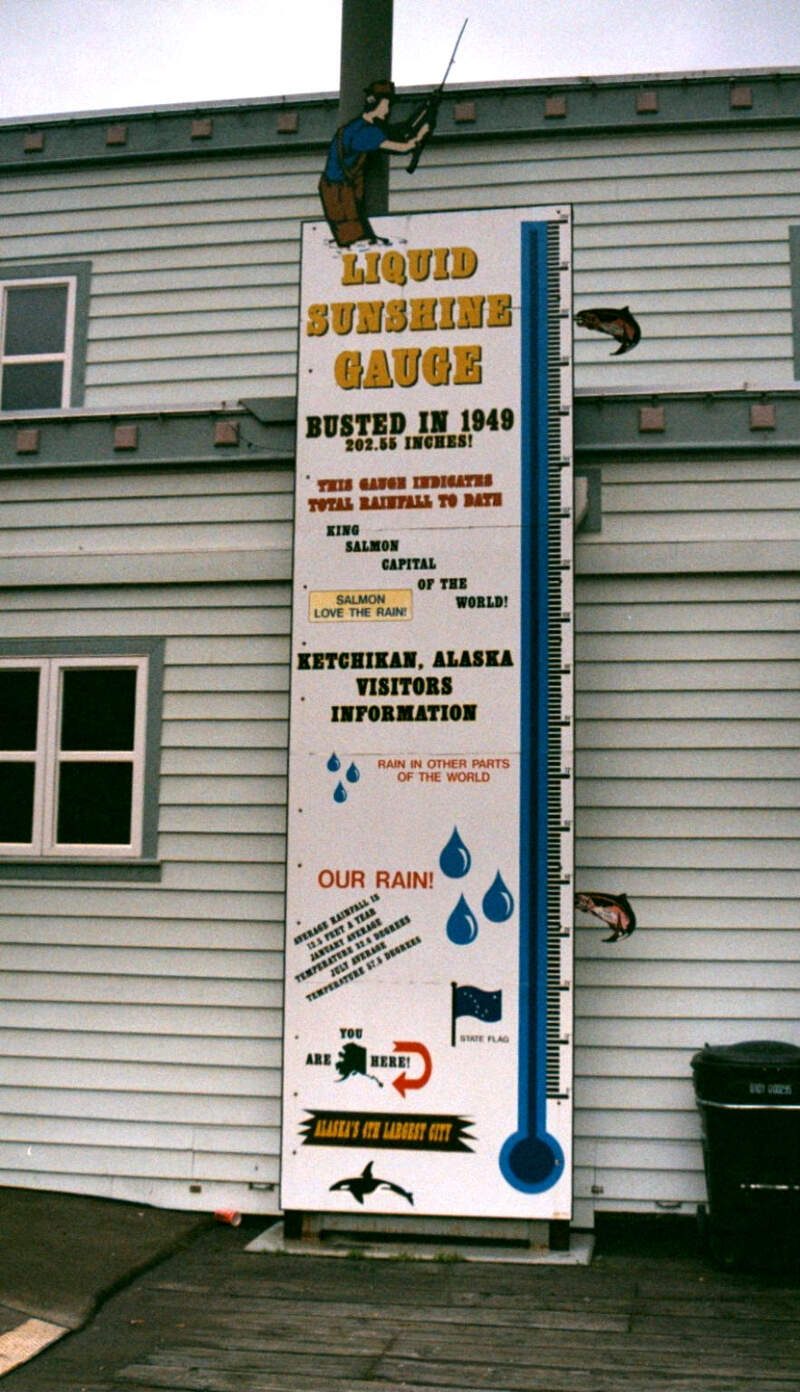
Ketchikan, AK Weather
The average high in Ketchikan is 50.9° and the average low is 39.3°.
There are 177.3 days of precipitation each year.
Expect an average of 141.3 inches of precipitation each year with 30.7 inches of snow.
| Stat | Ketchikan |
|---|---|
| Average Annual High | 50.9 |
| Average Annual Low | 39.3 |
| Annual Precipitation Days | 177.3 |
| Average Annual Precipitation | 141.3 |
| Average Annual Snowfall | 30.7 |
Average High
Days of Rain
Source: NOAA climate normals (30-year)
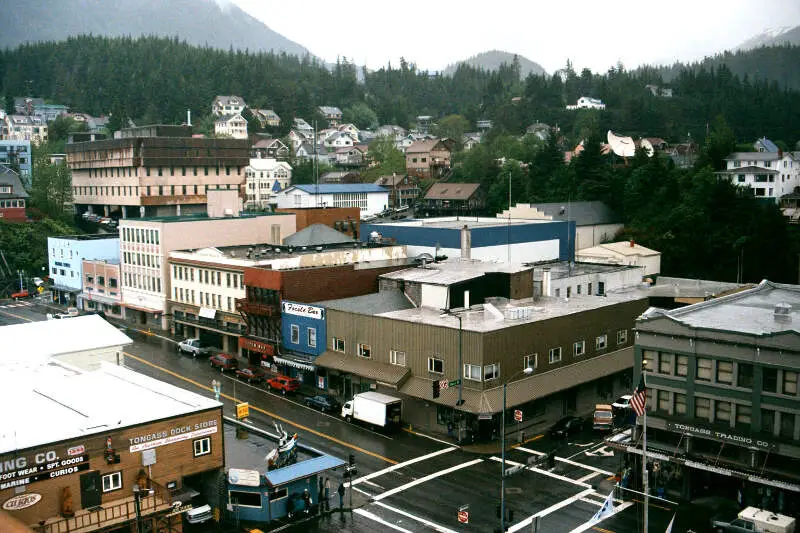
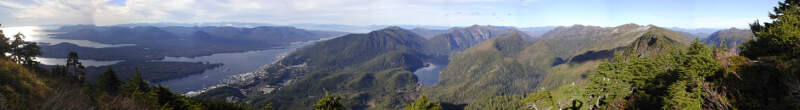
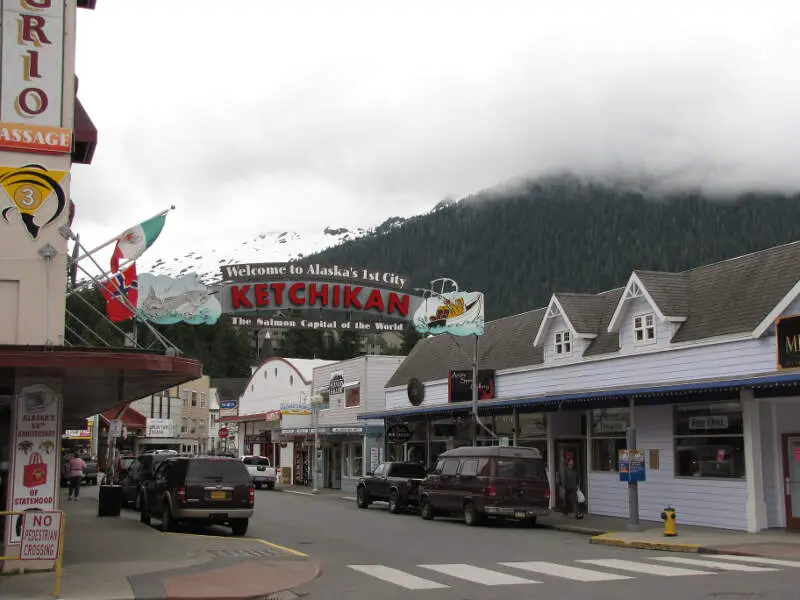
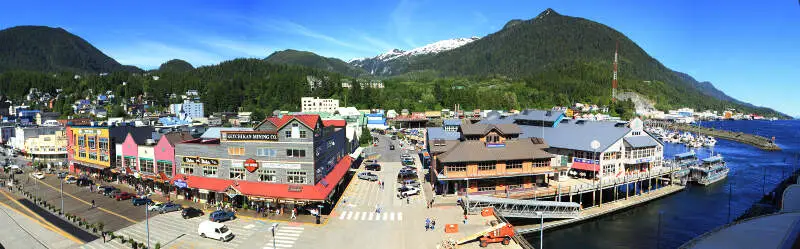
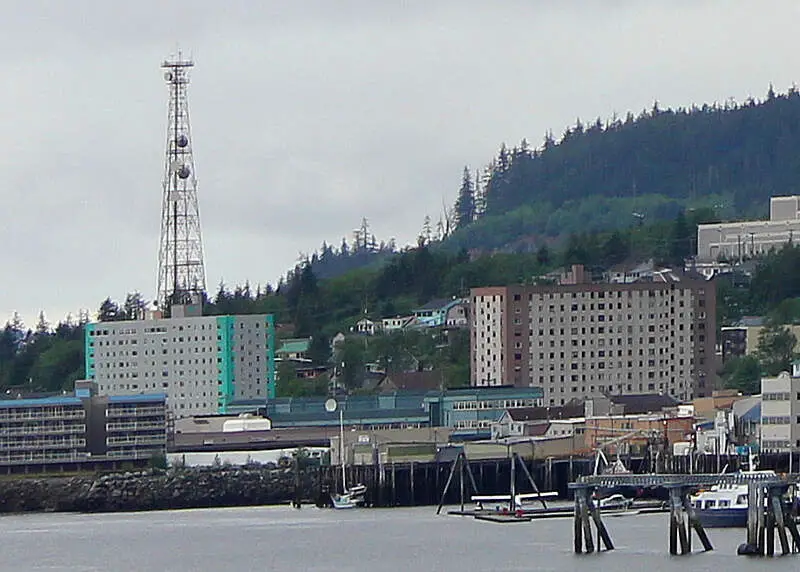
Ketchikan, AK Photos


2 Reviews & Comments About Ketchikan

Ketchikan gets a lot of rain - 300 days per year, but it's a great little tourist town. There are many nice shops and great ocean views.
Totem pole park was really neat and full of history!
I love this place. It's a safe place to raise your children.
The prices of groceries is pretty high. Even though the cost of living is high, it's awesome to live here.
Rankings & Articles For Ketchikan


Locations Around Ketchikan
Map Of Ketchikan, AK
Best Places Around Ketchikan
Ketchikan Demographics And Statistics
Population over time in Ketchikan
The current population in Ketchikan is 8,078. The population has increased 1.1% from 2010.
| Year | Population | % Change |
|---|---|---|
| 2024 | 8,078 | -0.9% |
| 2023 | 8,151 | -0.2% |
| 2022 | 8,168 | 0.2% |
| 2021 | 8,150 | -1.0% |
| 2020 | 8,230 | 0.0% |
| 2019 | 8,228 | 0.0% |
| 2018 | 8,224 | 0.4% |
| 2017 | 8,195 | 0.1% |
| 2016 | 8,189 | -0.1% |
| 2015 | 8,197 | 0.3% |
| 2014 | 8,173 | 0.5% |
| 2013 | 8,130 | 0.4% |
| 2012 | 8,097 | 1.1% |
| 2011 | 8,008 | 0.2% |
| 2010 | 7,994 | - |
Race / Ethnicity in Ketchikan
See the full breakdown
Ketchikan is:
52.0% White with 4,198 White residents.
0.7% African American with 59 African American residents.
14.7% American Indian with 1,188 American Indian residents.
13.9% Asian with 1,122 Asian residents.
0.2% Hawaiian with 15 Hawaiian residents.
0.0% Other with 0 Other residents.
12.4% Two Or More with 1,003 Two Or More residents.
6.1% Hispanic with 493 Hispanic residents.
| Race | Ketchikan | AK | USA |
|---|---|---|---|
| White | 52.0% | 57.7% | 57.4% |
| African American | 0.7% | 2.9% | 11.9% |
| American Indian | 14.7% | 13.2% | 0.5% |
| Asian | 13.9% | 6.4% | 5.9% |
| Hawaiian | 0.2% | 1.5% | 0.2% |
| Other | 0.0% | 0.7% | 0.6% |
| Two Or More | 12.4% | 10.3% | 4.3% |
| Hispanic | 6.1% | 7.3% | 19.3% |
Gender in Ketchikan
See the full breakdown
Ketchikan is 47.8% female with 3,859 female residents.
Ketchikan is 52.2% male with 4,218 male residents.
| Gender | Ketchikan | AK | USA |
|---|---|---|---|
| Female | 47.8% | 47.5% | 50.5% |
| Male | 52.2% | 52.5% | 49.5% |
Highest level of educational attainment in Ketchikan for adults over 25
See the full breakdown
2.0% of adults in Ketchikan completed < 9th grade.
4.0% of adults in Ketchikan completed 9-12th grade.
33.0% of adults in Ketchikan completed high school / ged.
29.0% of adults in Ketchikan completed some college.
8.0% of adults in Ketchikan completed associate's degree.
15.0% of adults in Ketchikan completed bachelor's degree.
6.0% of adults in Ketchikan completed master's degree.
1.0% of adults in Ketchikan completed professional degree.
2.0% of adults in Ketchikan completed doctorate degree.
| Education | Ketchikan | AK | USA |
|---|---|---|---|
| < 9th Grade | 2.0% | 1.0% | 4.0% |
| 9-12th Grade | 4.0% | 5.0% | 6.0% |
| High School / GED | 33.0% | 29.0% | 26.0% |
| Some College | 29.0% | 24.0% | 19.0% |
| Associate's Degree | 8.0% | 9.0% | 9.0% |
| Bachelor's Degree | 15.0% | 20.0% | 22.0% |
| Master's Degree | 6.0% | 9.0% | 10.0% |
| Professional Degree | 1.0% | 2.0% | 2.0% |
| Doctorate Degree | 2.0% | 1.0% | 2.0% |
Household Income For Ketchikan, Alaska
See the full breakdown
4.8% of households in Ketchikan earn Less than $10,000.
2.1% of households in Ketchikan earn $10,000 to $14,999.
7.5% of households in Ketchikan earn $15,000 to $24,999.
7.7% of households in Ketchikan earn $25,000 to $34,999.
8.8% of households in Ketchikan earn $35,000 to $49,999.
13.5% of households in Ketchikan earn $50,000 to $74,999.
13.6% of households in Ketchikan earn $75,000 to $99,999.
21.9% of households in Ketchikan earn $100,000 to $149,999.
10.4% of households in Ketchikan earn $150,000 to $199,999.
9.5% of households in Ketchikan earn $200,000 or more.
| Income | Ketchikan | AK | USA |
|---|---|---|---|
| Less than $10,000 | 4.8% | 3.7% | 5.0% |
| $10,000 to $14,999 | 2.1% | 2.1% | 3.4% |
| $15,000 to $24,999 | 7.5% | 5.4% | 6.3% |
| $25,000 to $34,999 | 7.7% | 4.9% | 6.6% |
| $35,000 to $49,999 | 8.8% | 8.9% | 10.1% |
| $50,000 to $74,999 | 13.5% | 14.7% | 15.5% |
| $75,000 to $99,999 | 13.6% | 13.6% | 12.6% |
| $100,000 to $149,999 | 21.9% | 19.9% | 17.5% |
| $150,000 to $199,999 | 10.4% | 12.0% | 9.6% |
| $200,000 or more | 9.5% | 14.6% | 13.4% |
Source: U.S. Census ACS 5-year estimates (2024)


