
Some of you might be asking yourself, at this very moment, is North Carolina a good place?
The answer is unequivocally yes… if you know where to locate the best counties to live in North Carolina.
Lucky for you, we’re here to help you identify the best counties to live in the Tar Heel State based on the most recently available data from the Census. And this isn’t our first rodeo — we’ve been using Saturday Night Science to rank places for years.
The question becomes if you wanted to relocate to the best part of North Carolina, where would you go? To answer that, we looked at crime, cost of living, and demographic data for all 100 counties in the state.
Table Of Contents: Top Ten | Methodology | Table | FAQs | Summary
The 10 Best Counties To Live In North Carolina For 2026
Wake County is the county to be when it comes to living the good life in North Carolina. And you should avoid Robeson County if you can — at least according to the data.
Now you know exactly where to move in North Carolina. Keep on reading for more about the top ten and a detailed methodology.
Or, check out the best places to live in North Carolina and the cheapest places to live in North Carolina.
Table Of Contents: Top Ten | Methodology | Summary | Table
The Best Counties To Live In North Carolina For 2026
1. Wake County

Biggest Place: Raleigh
Population: 1,178,653
Median Income: $105,768 (best)
Median Home Price: $479,726 (6th best)
Unemployment Rate: 4.1% (27th best)
More on Wake County: Data
2. Currituck County
Biggest Place: Moyock
Population: 30,601
Median Income: $93,511 (4th best)
Median Home Price: $541,876 (3rd best)
Unemployment Rate: 3.0% (8th best)
More on Currituck County: Data
3. Orange County

Biggest Place: Durham
Population: 149,678
Median Income: $90,089 (6th best)
Median Home Price: $505,611 (5th best)
Unemployment Rate: 3.6% (16th best)
More on Orange County: Data
4. Carteret County
Biggest Place: Morehead City
Population: 69,148
Median Income: $72,322 (2best)
Median Home Price: $470,748 (8th best)
Unemployment Rate: 4.0% (23rd best)
More on Carteret County: Data
5. Union County

Biggest Place: Indian Trail
Population: 250,958
Median Income: $102,900 (2nd best)
Median Home Price: $451,671 (10th best)
Unemployment Rate: 4.2% (3best)
More on Union County: Data
6. Brunswick County
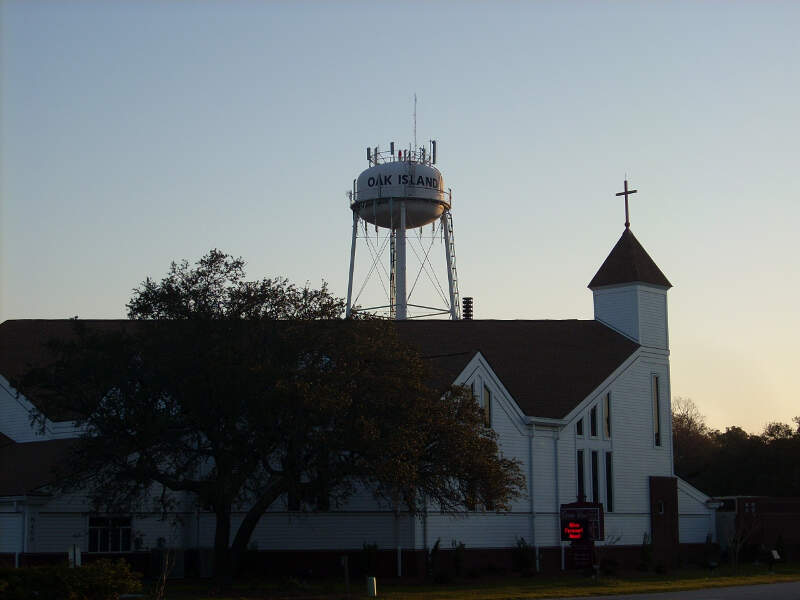
Biggest Place: Leland
Population: 152,568
Median Income: $77,024 (16th best)
Median Home Price: $405,145 (17th best)
Unemployment Rate: 4.7% (44th best)
More on Brunswick County: Data
7. Chatham County
Biggest Place: Cary
Population: 80,151
Median Income: $94,317 (3rd best)
Median Home Price: $550,017 (2nd best)
Unemployment Rate: 2.9% (7th best)
More on Chatham County: Data
8. Camden County

Biggest Place: Elizabeth City
Population: 10,927
Median Income: $91,078 (5th best)
Median Home Price: $393,332 (20th best)
Unemployment Rate: 5.5% (7best)
More on Camden County: Data
9. Moore County
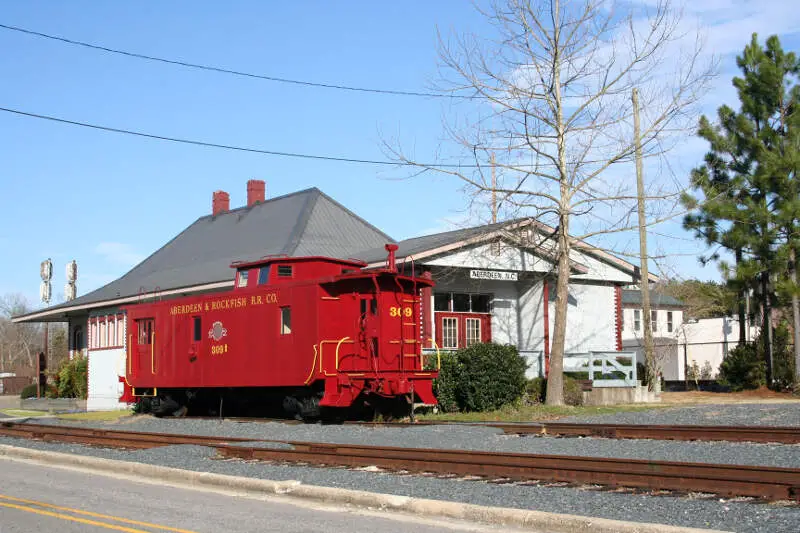
Biggest Place: Pinehurst
Population: 104,876
Median Income: $86,080 (10th best)
Median Home Price: $413,085 (16th best)
Unemployment Rate: 4.8% (50th best)
More on Moore County: Data
10. Cabarrus County

Biggest Place: Concord
Population: 236,133
Median Income: $89,005 (7th best)
Median Home Price: $384,693 (23rd best)
Unemployment Rate: 4.6% (43rd best)
More on Cabarrus County: Data
Methodology: How do you determine which North Carolina county is the best?
To give you the best county in North Carolina, we have to look at a handful of metrics that signal the quality of a place. To do that, we made assumptions about what’s in a “best county” and what isn’t. For reference, we are trying to make the kind of argument you’d make at a bar using facts, Saturday Night Science.
With that in mind, we went to two of the best data sources on the internet. Namely, the American Community Survey data and FBI Crime data for the most recent period.
We paid particular attention to:
- Violent Crime Rates
- Property Crime Rates
- Median Home Values
- Median Income
- Unemployment Rates
- Adult Education Levels
- Health Insurance Coverage
- Poverty Rates
We then ranked each county in North Carolina across each of the criteria from one to 100, with one being the best.
Taking the average rank across all criteria, we created a quality of life score with the county posting the lowest overall score being the “Best County To Live In North Carolina.”
The result is some of the safest, quietest, and best counties to raise a family in the Tar Heel State.
We updated this article for 2026. This report is our eleventh time ranking the best counties to live in North Carolina.
Read on to see why Wake County is the best county, while Robeson County is probably in contention for being the worst county in North Carolina.
Summary: The Best Counties In North Carolina To Call Home For 2026
Living in North Carolina can vary from one part of the state to the next — who woulda thought?
The best counties in North Carolina are Wake County, Currituck County, Orange County, Carteret County, Union County, Brunswick County, Chatham County, Camden County, Moore County, and Cabarrus County.
But now you know the outstanding parts and the parts to avoid, and that’s why you came here to learn at the end of the day.
You are welcome.
Here’s a look at the worst counties in North Carolina according to the data:
- Robeson County
- Richmond County
- Scotland County
For more North Carolina reading, check out:
- Best Places To Retire In North Carolina
- Best Counties To Live In North Carolina
- Safest Cities in North Carolina
- Cheapest Places To Live In North Carolina
Detailed List Of The Best Counties In North Carolina
| Rank | County | Population | Median Income | Median Home Price |
|---|---|---|---|---|
| 1 | Wake County | 1,178,653 | $105,768 | $479,726 |
| 2 | Currituck County | 30,601 | $93,511 | $541,876 |
| 3 | Orange County | 149,678 | $90,089 | $505,611 |
| 4 | Carteret County | 69,148 | $72,322 | $470,748 |
| 5 | Union County | 250,958 | $102,900 | $451,671 |
| 6 | Brunswick County | 152,568 | $77,024 | $405,145 |
| 7 | Chatham County | 80,151 | $94,317 | $550,017 |
| 8 | Camden County | 10,927 | $91,078 | $393,332 |
| 9 | Moore County | 104,876 | $86,080 | $413,085 |
| 10 | Cabarrus County | 236,133 | $89,005 | $384,693 |
| 11 | Dare County | 37,875 | $88,994 | $600,596 |
| 12 | Lincoln County | 92,716 | $80,016 | $401,881 |
| 13 | Iredell County | 196,544 | $81,419 | $386,376 |
| 14 | Pender County | 65,550 | $80,396 | $436,166 |
| 15 | New Hanover County | 235,229 | $75,166 | $444,935 |
| 16 | Davie County | 44,122 | $75,057 | $321,974 |
| 17 | Durham County | 332,353 | $82,316 | $397,037 |
| 18 | Transylvania County | 33,691 | $66,184 | $474,864 |
| 19 | Stokes County | 45,139 | $62,969 | $258,748 |
| 20 | Johnston County | 234,263 | $83,384 | $343,004 |
| 21 | Buncombe County | 274,360 | $74,436 | $454,250 |
| 22 | Madison County | 21,867 | $58,531 | $392,632 |
| 23 | Henderson County | 118,484 | $68,187 | $422,832 |
| 24 | Perquimans County | 13,244 | $67,917 | $277,277 |
| 25 | Mecklenburg County | 1,154,681 | $87,005 | $421,452 |
| 26 | Craven County | 102,612 | $65,873 | $273,661 |
| 27 | Franklin County | 74,386 | $74,240 | $362,847 |
| 28 | Guilford County | 547,940 | $68,642 | $278,467 |
| 29 | Haywood County | 62,662 | $61,912 | $341,225 |
| 30 | Onslow County | 207,906 | $68,148 | $289,956 |
| 31 | Gates County | 10,376 | $66,333 | $246,167 |
| 32 | Polk County | 19,891 | $67,758 | $316,132 |
| 33 | Granville County | 60,877 | $71,111 | $317,381 |
| 34 | Clay County | 11,610 | $56,971 | $340,067 |
| 35 | Davidson County | 172,954 | $64,172 | $273,745 |
| 36 | Harnett County | 139,150 | $71,287 | $294,553 |
| 37 | Catawba County | 163,573 | $67,864 | $292,677 |
| 38 | Macon County | 37,941 | $59,061 | $360,443 |
| 39 | Stanly County | 64,651 | $60,704 | $303,693 |
| 40 | Yancey County | 18,797 | $58,709 | $321,487 |
| 41 | Forsyth County | 389,977 | $67,165 | $285,371 |
| 42 | Pamlico County | 12,390 | $59,717 | $273,404 |
| 43 | Alexander County | 36,412 | $65,354 | $263,714 |
| 44 | Cherokee County | 29,562 | $53,628 | $269,304 |
| 45 | Gaston County | 234,881 | $67,478 | $297,719 |
| 46 | Avery County | 17,680 | $61,428 | $384,556 |
| 47 | Ashe County | 26,950 | $56,866 | $346,186 |
| 48 | Pasquotank County | 40,834 | $66,589 | $265,168 |
| 49 | Alamance County | 176,893 | $65,651 | $294,316 |
| 50 | Rowan County | 149,875 | $65,725 | $276,269 |
| 51 | Beaufort County | 44,499 | $58,357 | $233,490 |
| 52 | Chowan County | 13,836 | $53,864 | $232,683 |
| 53 | Watauga County | 55,123 | $51,693 | $506,670 |
| 54 | Mitchell County | 14,992 | $57,602 | $231,962 |
| 55 | Nash County | 96,216 | $62,426 | $237,061 |
| 56 | Randolph County | 146,348 | $61,022 | $253,644 |
| 57 | Jackson County | 43,771 | $55,815 | $444,170 |
| 58 | Lee County | 65,816 | $65,387 | $292,368 |
| 59 | Cumberland County | 338,545 | $61,291 | $231,841 |
| 60 | Jones County | 9,302 | $59,641 | $136,421 |
| 61 | Person County | 39,542 | $63,300 | $253,001 |
| 62 | Burke County | 87,795 | $58,592 | $255,517 |
| 63 | Mcdowell County | 44,817 | $57,168 | $260,303 |
| 64 | Pitt County | 177,193 | $58,188 | $243,761 |
| 65 | Hoke County | 53,835 | $64,912 | $277,586 |
| 66 | Cleveland County | 100,991 | $58,534 | $209,382 |
| 67 | Yadkin County | 37,574 | $62,932 | $241,129 |
| 68 | Caldwell County | 80,536 | $56,425 | $237,080 |
| 69 | Montgomery County | 26,007 | $57,766 | $196,636 |
| 70 | Surry County | 71,425 | $55,656 | $231,797 |
| 71 | Rockingham County | 92,131 | $57,053 | $197,299 |
| 72 | Caswell County | 22,404 | $59,755 | $213,218 |
| 73 | Hyde County | 4,592 | $53,713 | $222,154 |
| 74 | Alleghany County | 11,174 | $47,172 | $269,502 |
| 75 | Wayne County | 118,652 | $59,733 | $186,088 |
| 76 | Graham County | 8,072 | $49,684 | $220,117 |
| 77 | Wilkes County | 65,935 | $51,721 | $225,624 |
| 78 | Columbus County | 50,140 | $49,442 | $183,768 |
| 79 | Martin County | 21,644 | $48,578 | $126,739 |
| 80 | Tyrrell County | 3,423 | $41,685 | $167,041 |
| 81 | Rutherford County | 64,930 | $51,410 | $222,161 |
| 82 | Wilson County | 79,290 | $56,423 | $221,169 |
| 83 | Swain County | 14,013 | $52,349 | $324,621 |
| 84 | Northampton County | 16,931 | $50,086 | $111,076 |
| 85 | Bertie County | 17,170 | $48,750 | $65,559 |
| 86 | Bladen County | 29,566 | $42,422 | $157,230 |
| 87 | Hertford County | 19,908 | $45,537 | $122,055 |
| 88 | Warren County | 18,795 | $50,638 | $242,861 |
| 89 | Sampson County | 59,470 | $52,432 | $152,822 |
| 90 | Duplin County | 49,335 | $55,148 | $186,277 |
| 91 | Washington County | 10,812 | $41,813 | $106,836 |
| 92 | Edgecombe County | 48,736 | $51,265 | $135,072 |
| 93 | Vance County | 42,322 | $50,465 | $183,618 |
| 94 | Halifax County | 47,675 | $45,590 | $103,624 |
| 95 | Lenoir County | 54,919 | $45,143 | $153,994 |
| 96 | Anson County | 22,289 | $47,302 | $141,107 |
| 97 | Greene County | 20,486 | $53,244 | $182,392 |
| 98 | Scotland County | 33,590 | $45,730 | $145,230 |
| 99 | Richmond County | 42,344 | $44,883 | $132,397 |
| 100 | Robeson County | 116,902 | $41,978 | $135,501 |