
Some of you might be asking yourself, at this very moment, is South Carolina a good place?
The answer is unequivocally yes… if you know where to locate the best counties to live in South Carolina.
Lucky for you, we’re here to help you identify the best counties to live in the Palmetto State based on the most recently available data from the Census. And this isn’t our first rodeo — we’ve been using Saturday Night Science to rank places for years.
The question becomes if you wanted to relocate to the best part of South Carolina, where would you go? To answer that, we looked at crime, cost of living, and demographic data for all 46 counties in the state.
Table Of Contents: Top Ten | Methodology | Table | FAQs | Summary
The 10 Best Counties To Live In South Carolina For 2026
Beaufort County is the county to be when it comes to living the good life in South Carolina. And you should avoid Marlboro County if you can — at least according to the data.
Now you know exactly where to move in South Carolina. Keep on reading for more about the top ten and a detailed methodology.
Or, check out the best places to live in South Carolina and the cheapest places to live in South Carolina.
Table Of Contents: Top Ten | Methodology | Summary | Table
The Best Counties To Live In South Carolina For 2026
1. Beaufort County
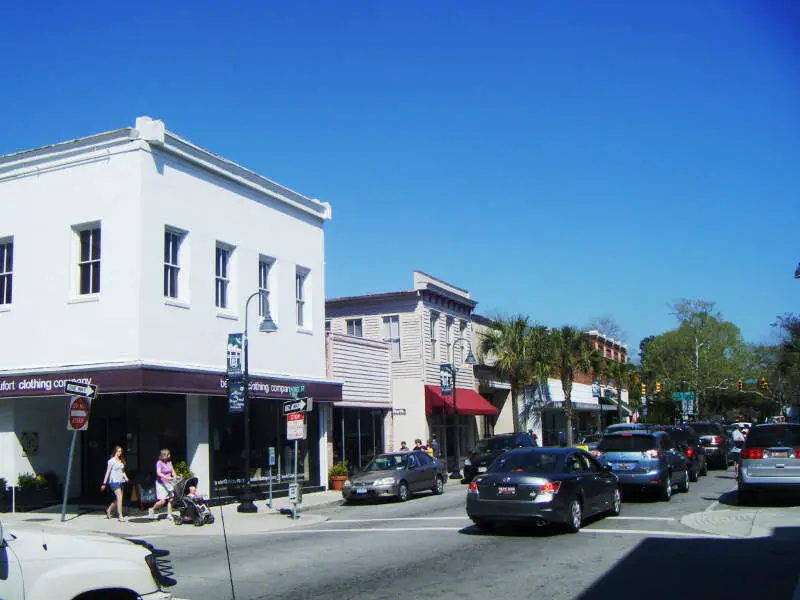
Biggest Place: Hilton Head Island
Population: 195,289
Median Income: $86,573 (3rd best)
Median Home Price: $546,769 (2nd best)
Unemployment Rate: 2.6% (best)
More on Beaufort County: Data
2. York County
Biggest Place: Rock Hill
Population: 293,673
Median Income: $89,095 (best)
Median Home Price: $389,726 (5th best)
Unemployment Rate: 4.1% (8th best)
More on York County: Data
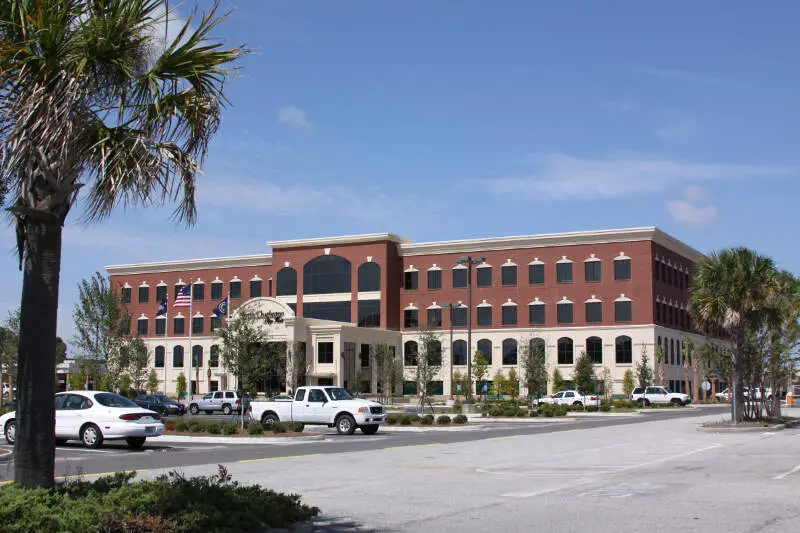
3. Charleston County
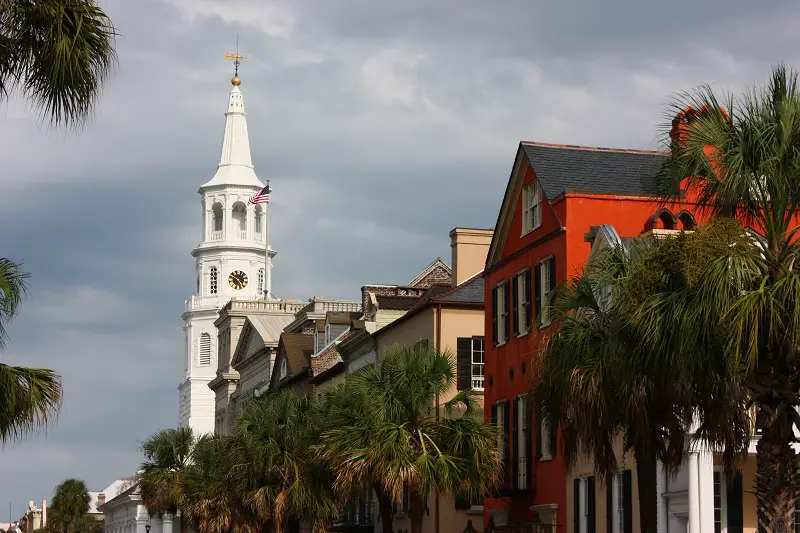
Biggest Place: Charleston
Population: 420,264
Median Income: $88,494 (2nd best)
Median Home Price: $611,187 (best)
Unemployment Rate: 3.5% (4th best)
More on Charleston County: Data
4. Berkeley County
Biggest Place: Charleston
Population: 246,802
Median Income: $84,358 (4th best)
Median Home Price: $368,747 (7th best)
Unemployment Rate: 3.2% (2nd best)
More on Berkeley County: Data
5. Lancaster County

Biggest Place: Lancaster
Population: 104,475
Median Income: $78,869 (5th best)
Median Home Price: $391,457 (4th best)
Unemployment Rate: 4.3% (9th best)
More on Lancaster County: Data
6. Lexington County

Biggest Place: Columbia
Population: 304,887
Median Income: $77,408 (7th best)
Median Home Price: $271,338 (16th best)
Unemployment Rate: 4.5% (15th best)
More on Lexington County: Data
7. Greenville County
Biggest Place: Greenville
Population: 548,166
Median Income: $76,932 (8th best)
Median Home Price: $336,410 (9th best)
Unemployment Rate: 4.4% (11th best)
More on Greenville County: Data
8. Georgetown County
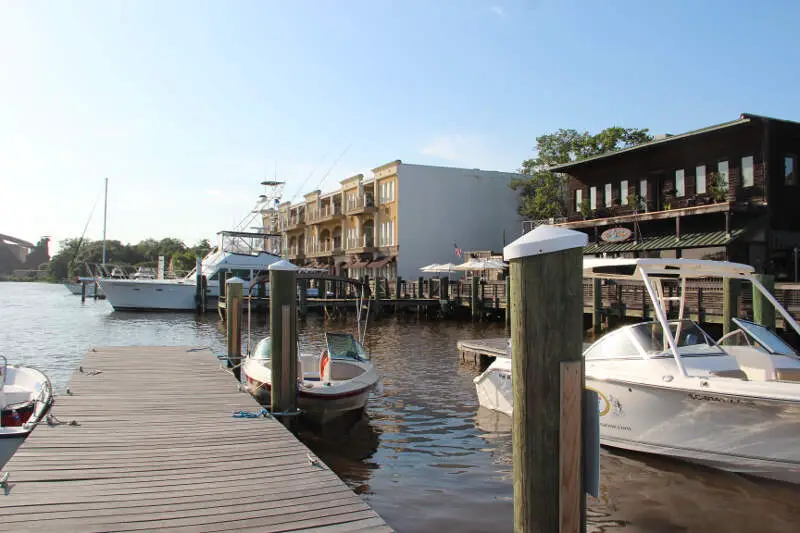
Biggest Place: Murrells Inlet
Population: 64,811
Median Income: $68,713 (11th best)
Median Home Price: $384,130 (6th best)
Unemployment Rate: 4.4% (13th best)
More on Georgetown County: Data
9. Dorchester County
Biggest Place: North Charleston
Population: 167,201
Median Income: $78,198 (6th best)
Median Home Price: $345,663 (8th best)
Unemployment Rate: 4.9% (2best)
More on Dorchester County: Data
10. Kershaw County

Biggest Place: Lugoff
Population: 68,314
Median Income: $68,231 (12th best)
Median Home Price: $251,652 (18th best)
Unemployment Rate: 4.7% (18th best)
More on Kershaw County: Data
Methodology: How do you determine which South Carolina county is the best?
To give you the best county in South Carolina, we have to look at a handful of metrics that signal the quality of a place. To do that, we made assumptions about what’s in a “best county” and what isn’t. For reference, we are trying to make the kind of argument you’d make at a bar using facts, Saturday Night Science.
With that in mind, we went to two of the best data sources on the internet. Namely, the American Community Survey data and FBI Crime data for the most recent period.
We paid particular attention to:
- Violent Crime Rates
- Property Crime Rates
- Median Home Values
- Median Income
- Unemployment Rates
- Adult Education Levels
- Health Insurance Coverage
- Poverty Rates
We then ranked each county in South Carolina across each of the criteria from one to 46, with one being the best.
Taking the average rank across all criteria, we created a quality of life score with the county posting the lowest overall score being the “Best County To Live In South Carolina.”
The result is some of the safest, quietest, and best counties to raise a family in the Palmetto State.
We updated this article for 2026. This report is our eleventh time ranking the best counties to live in South Carolina.
Read on to see why Beaufort County is the best county, while Marlboro County is probably in contention for being the worst county in South Carolina.
Summary: The Best Counties In South Carolina To Call Home For 2026
Living in South Carolina can vary from one part of the state to the next — who woulda thought?
The best counties in South Carolina are Beaufort County, York County, Charleston County, Berkeley County, Lancaster County, Lexington County, Greenville County, Georgetown County, Dorchester County, and Kershaw County.
But now you know the outstanding parts and the parts to avoid, and that’s why you came here to learn at the end of the day.
You are welcome.
Here’s a look at the worst counties in South Carolina according to the data:
- Marlboro County
- Allendale County
- Bamberg County
For more South Carolina reading, check out:
- Best Counties To Live In South Carolina
- Richest Cities In South Carolina
- Best Places To Raise A Family In South Carolina
- Best Places To Retire In South Carolina
Detailed List Of The Best Counties In South Carolina
| Rank | County | Population | Median Income | Median Home Price |
|---|---|---|---|---|
| 1 | Beaufort County | 195,289 | $86,573 | $546,769 |
| 2 | York County | 293,673 | $89,095 | $389,726 |
| 3 | Charleston County | 420,264 | $88,494 | $611,187 |
| 4 | Berkeley County | 246,802 | $84,358 | $368,747 |
| 5 | Lancaster County | 104,475 | $78,869 | $391,457 |
| 6 | Lexington County | 304,887 | $77,408 | $271,338 |
| 7 | Greenville County | 548,166 | $76,932 | $336,410 |
| 8 | Georgetown County | 64,811 | $68,713 | $384,130 |
| 9 | Dorchester County | 167,201 | $78,198 | $345,663 |
| 10 | Kershaw County | 68,314 | $68,231 | $251,652 |
| 11 | Pickens County | 134,629 | $61,064 | $299,969 |
| 12 | Aiken County | 174,160 | $70,609 | $234,750 |
| 13 | Horry County | 383,016 | $66,880 | $316,676 |
| 14 | Mccormick County | 9,760 | $55,798 | $322,811 |
| 15 | Spartanburg County | 347,852 | $66,234 | $276,789 |
| 16 | Richland County | 422,117 | $63,784 | $243,518 |
| 17 | Newberry County | 38,435 | $61,780 | $219,121 |
| 18 | Calhoun County | 14,182 | $58,682 | $211,151 |
| 19 | Anderson County | 210,478 | $66,651 | $290,746 |
| 20 | Jasper County | 32,166 | $65,613 | $401,191 |
| 21 | Abbeville County | 24,420 | $52,935 | $203,730 |
| 22 | Greenwood County | 69,489 | $52,830 | $170,948 |
| 23 | Edgefield County | 27,476 | $73,029 | $267,374 |
| 24 | Fairfield County | 20,550 | $47,885 | $188,558 |
| 25 | Oconee County | 80,469 | $62,388 | $287,575 |
| 26 | Sumter County | 104,725 | $56,693 | $213,438 |
| 27 | Florence County | 137,117 | $58,305 | $200,490 |
| 28 | Clarendon County | 30,986 | $52,401 | $183,162 |
| 29 | Laurens County | 68,666 | $57,623 | $198,928 |
| 30 | Saluda County | 19,131 | $51,009 | $211,297 |
| 31 | Chester County | 32,182 | $52,458 | $212,488 |
| 32 | Darlington County | 62,558 | $48,581 | $165,454 |
| 33 | Cherokee County | 56,647 | $50,288 | $186,421 |
| 34 | Williamsburg County | 30,282 | $46,213 | $130,756 |
| 35 | Colleton County | 38,783 | $51,114 | $251,054 |
| 36 | Orangeburg County | 83,253 | $45,675 | $160,248 |
| 37 | Chesterfield County | 43,784 | $49,235 | $173,788 |
| 38 | Hampton County | 18,254 | $44,711 | $152,974 |
| 39 | Lee County | 16,166 | $44,760 | $134,515 |
| 40 | Barnwell County | 20,521 | $46,626 | $149,828 |
| 41 | Union County | 26,885 | $41,621 | $129,393 |
| 42 | Marion County | 28,664 | $36,301 | $137,377 |
| 43 | Dillon County | 27,862 | $46,605 | $109,965 |
| 44 | Bamberg County | 13,042 | $44,370 | $127,289 |
| 45 | Allendale County | 7,661 | $32,328 | $71,542 |
| 46 | Marlboro County | 25,975 | $34,301 | $83,301 |