
Some of you might be asking yourself, at this very moment, is South Dakota a good place?
The answer is unequivocally yes… if you know where to locate the best counties to live in South Dakota.
Lucky for you, we’re here to help you identify the best counties to live in the Mount Rushmore State based on the most recently available data from the Census. And this isn’t our first rodeo — we’ve been using Saturday Night Science to rank places for years.
The question becomes if you wanted to relocate to the best part of South Dakota, where would you go? To answer that, we looked at crime, cost of living, and demographic data for all 65 counties in the state.
Table Of Contents: Top Ten | Methodology | Table | FAQs | Summary
The 10 Best Counties To Live In South Dakota For 2026
Stanley County is the county to be when it comes to living the good life in South Dakota. And you should avoid Todd County if you can — at least according to the data.
Now you know exactly where to move in South Dakota. Keep on reading for more about the top ten and a detailed methodology.
Or, check out the best places to live in South Dakota and the cheapest places to live in South Dakota.
Table Of Contents: Top Ten | Methodology | Summary | Table
The Best Counties To Live In South Dakota For 2026
1. Stanley County
Biggest Place: Fort Pierre
Population: 3,015
Median Income: $87,712 (3rd best)
Median Home Price: $312,917 (11th best)
Unemployment Rate: 0.5% (6th best)
More on Stanley County: Data
2. Lincoln County
Biggest Place: Sioux Falls
Population: 70,638
Median Income: $99,166 (best)
Median Home Price: $378,566 (4th best)
Unemployment Rate: 1.7% (2best)
More on Lincoln County: Data
3. Harding County
Biggest Place: Buffalo
Population: 1,148
Median Income: $80,441 (12th best)
Median Home Price: $275,935 (22nd best)
Unemployment Rate: 0.9% (11th best)
More on Harding County: Data
4. Union County
Biggest Place: Dakota Dunes
Population: 17,081
Median Income: $89,636 (2nd best)
Median Home Price: $353,490 (7th best)
Unemployment Rate: 3.0% (43rd best)
More on Union County: Data
5. Hand County
Biggest Place: Miller
Population: 3,140
Median Income: $74,635 (23rd best)
Median Home Price: $256,242 (25th best)
Unemployment Rate: 0.8% (9th best)
More on Hand County: Data
6. Hughes County
Biggest Place: Pierre
Population: 17,664
Median Income: $81,395 (10th best)
Median Home Price: $289,410 (17th best)
Unemployment Rate: 1.0% (12th best)
More on Hughes County: Data
7. Sully County
Biggest Place: Onida
Population: 1,526
Median Income: $72,578 (34th best)
Median Home Price: $278,457 (2best)
Unemployment Rate: 0.0% (best)
More on Sully County: Data
8. Marshall County
Biggest Place: Britton
Population: 4,344
Median Income: $78,156 (15th best)
Median Home Price: $234,505 (34th best)
Unemployment Rate: 0.3% (4th best)
More on Marshall County: Data
9. Hamlin County
Biggest Place: Lake Norden
Population: 6,373
Median Income: $87,101 (4th best)
Median Home Price: $329,796 (9th best)
Unemployment Rate: 0.5% (7th best)
More on Hamlin County: Data
10. Lake County
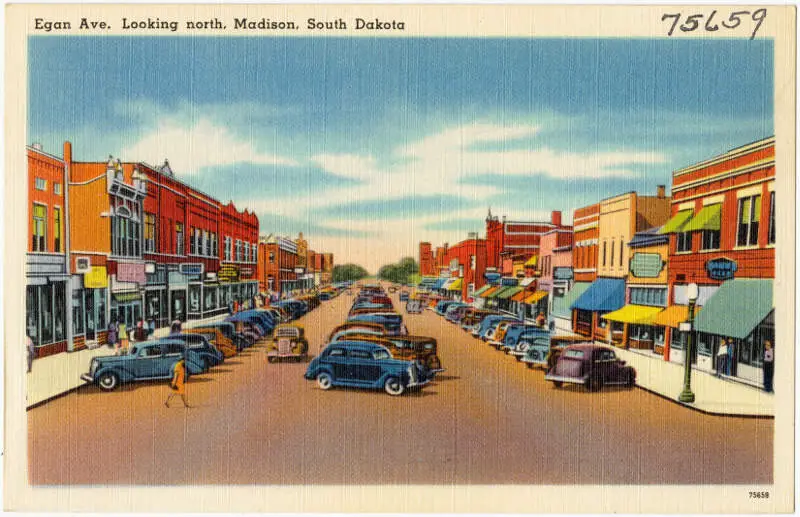
Biggest Place: Madison
Population: 10,972
Median Income: $76,808 (17th best)
Median Home Price: $306,911 (14th best)
Unemployment Rate: 3.0% (42nd best)
More on Lake County: Data
Methodology: How do you determine which South Dakota county is the best?
To give you the best county in South Dakota, we have to look at a handful of metrics that signal the quality of a place. To do that, we made assumptions about what’s in a “best county” and what isn’t. For reference, we are trying to make the kind of argument you’d make at a bar using facts, Saturday Night Science.
With that in mind, we went to two of the best data sources on the internet. Namely, the American Community Survey data and FBI Crime data for the most recent period.
We paid particular attention to:
- Violent Crime Rates
- Property Crime Rates
- Median Home Values
- Median Income
- Unemployment Rates
- Adult Education Levels
- Health Insurance Coverage
- Poverty Rates
We then ranked each county in South Dakota across each of the criteria from one to 65, with one being the best.
Taking the average rank across all criteria, we created a quality of life score with the county posting the lowest overall score being the “Best County To Live In South Dakota.”
The result is some of the safest, quietest, and best counties to raise a family in the Mount Rushmore State.
We updated this article for 2026. This report is our eleventh time ranking the best counties to live in South Dakota.
Read on to see why Stanley County is the best county, while Todd County is probably in contention for being the worst county in South Dakota.
Summary: The Best Counties In South Dakota To Call Home For 2026
Living in South Dakota can vary from one part of the state to the next — who woulda thought?
The best counties in South Dakota are Stanley County, Lincoln County, Harding County, Union County, Hand County, Hughes County, Sully County, Marshall County, Hamlin County, and Lake County.
But now you know the outstanding parts and the parts to avoid, and that’s why you came here to learn at the end of the day.
You are welcome.
Here’s a look at the worst counties in South Dakota according to the data:
- Todd County
- Mellette County
- Buffalo County
For more South Dakota reading, check out:
- Best Places To Retire In South Dakota
- Best Places To Raise A Family In South Dakota
- Safest Places In South Dakota
- Richest Cities In South Dakota
Detailed List Of The Best Counties In South Dakota
| Rank | County | Population | Median Income | Median Home Price |
|---|---|---|---|---|
| 1 | Stanley County | 3,015 | $87,712 | $312,917 |
| 2 | Lincoln County | 70,638 | $99,166 | $378,566 |
| 3 | Harding County | 1,148 | $80,441 | $275,935 |
| 4 | Union County | 17,081 | $89,636 | $353,490 |
| 5 | Hand County | 3,140 | $74,635 | $256,242 |
| 6 | Hughes County | 17,664 | $81,395 | $289,410 |
| 7 | Sully County | 1,526 | $72,578 | $278,457 |
| 8 | Marshall County | 4,344 | $78,156 | $234,505 |
| 9 | Hamlin County | 6,373 | $87,101 | $329,796 |
| 10 | Lake County | 10,972 | $76,808 | $306,911 |
| 11 | Mccook County | 5,751 | $83,852 | $287,315 |
| 12 | Jerauld County | 1,772 | $73,750 | $242,970 |
| 13 | Custer County | 8,892 | $84,112 | $507,259 |
| 14 | Deuel County | 4,328 | $83,112 | $312,819 |
| 15 | Potter County | 2,388 | $72,045 | $232,681 |
| 16 | Codington County | 28,767 | $72,727 | $335,019 |
| 17 | Miner County | 2,300 | $76,140 | $193,715 |
| 18 | Meade County | 30,546 | $74,790 | $394,532 |
| 19 | Haakon County | 1,722 | $65,625 | $202,314 |
| 20 | Edmunds County | 4,048 | $81,630 | $223,899 |
| 21 | Sanborn County | 2,384 | $78,750 | $238,878 |
| 22 | Lawrence County | 27,233 | $73,384 | $449,278 |
| 23 | Kingsbury County | 5,244 | $74,000 | $252,217 |
| 24 | Turner County | 8,882 | $75,771 | $297,528 |
| 25 | Hanson County | 3,472 | $81,071 | $235,581 |
| 26 | Minnehaha County | 203,289 | $76,880 | $323,682 |
| 27 | Yankton County | 23,414 | $72,821 | $274,933 |
| 28 | Brookings County | 35,353 | $70,064 | $312,525 |
| 29 | Pennington County | 113,512 | $74,517 | $362,723 |
| 30 | Aurora County | 2,642 | $72,885 | $187,159 |
| 31 | Moody County | 6,397 | $78,427 | $293,836 |
| 32 | Butte County | 10,676 | $75,652 | $355,827 |
| 33 | Hutchinson County | 7,404 | $73,977 | $217,198 |
| 34 | Campbell County | 1,593 | $68,929 | $209,027 |
| 35 | Brule County | 5,283 | $73,720 | $246,696 |
| 36 | Douglas County | 2,828 | $86,442 | $205,641 |
| 37 | Hyde County | 1,191 | $73,472 | $223,753 |
| 38 | Spink County | 6,219 | $70,139 | $169,579 |
| 39 | Davison County | 19,952 | $66,208 | $246,850 |
| 40 | Brown County | 37,877 | $70,898 | $238,214 |
| 41 | Grant County | 7,563 | $75,028 | $233,712 |
| 42 | Day County | 5,437 | $66,033 | $251,188 |
| 43 | Bon Homme County | 7,044 | $64,435 | $172,895 |
| 44 | Mcpherson County | 2,145 | $66,906 | $105,469 |
| 45 | Fall River County | 7,258 | $67,917 | $273,966 |
| 46 | Clark County | 3,917 | $70,726 | $206,810 |
| 47 | Jones County | 1,004 | $65,119 | $172,004 |
| 48 | Gregory County | 4,016 | $62,917 | $172,373 |
| 49 | Perkins County | 3,001 | $66,908 | $175,636 |
| 50 | Beadle County | 19,309 | $67,681 | $184,429 |
| 51 | Clay County | 15,219 | $56,850 | $284,411 |
| 52 | Roberts County | 10,221 | $65,130 | $227,173 |
| 53 | Faulk County | 2,126 | $57,750 | $181,737 |
| 54 | Charles Mix County | 9,281 | $64,038 | $280,406 |
| 55 | Tripp County | 5,611 | $58,987 | $199,702 |
| 56 | Walworth County | 5,271 | $65,026 | $134,455 |
| 57 | Lyman County | 3,724 | $67,143 | $204,285 |
| 58 | Bennett County | 3,345 | $53,750 | $224,609 |
| 59 | Jackson County | 2,802 | $35,417 | $158,433 |
| 60 | Corson County | 3,806 | $46,406 | $175,444 |
| 61 | Ziebach County | 2,377 | $53,958 | $122,719 |
| 62 | Dewey County | 5,205 | $54,104 | $85,755 |
| 63 | Buffalo County | 1,808 | $47,045 | $145,143 |
| 64 | Mellette County | 1,943 | $54,076 | $103,621 |
| 65 | Todd County | 9,244 | $42,075 | $66,411 |