So, you want to catch ’em all, huh?
Pokemon Go has swept the nation, and the app has broken records for the most downloads in the first week of release. All over the country, people are swarming, gathering, and all around going nuts, playing this interactive game.
Since we’re a data analytics website, and because we’re often cited as the ‘go to’ place for regional infotainment, we thought it was our duty to be as helpful as we can for people in California who want to have the inside scoop as to where they should go if they want to dominate this addicting game.
After analyzing every place in California, here is our list of the best places to catch Pokemon in the Golden State:
- Villa Park (Photos)
- Sausalito (Photos)
- Woodside (Photos)
- La Habra Heights
- Rolling Hills Estates (Photos)
- Tiburon (Photos)
- Atherton (Photos)
- Loomis
- Emeryville (Photos)
- Indian Wells (Photos)
As you might note, these are all smaller suburbs of major cities in California. That’s because in smaller cities, there are a higher number of places per capita where Pokemon are traditionally found. Meaning you’ll find more Pokemon in a much smaller area. When you read the analysis below, this will all make sense. Trust us.
So, grab your avatars, cell phones, and your Poke Balls as we uncover the truly best places in California in which to find the most Pokemon, based on data.
For more California reading , check out:
- 10 Best Places To Raise A Family In California
- 10 Cheapest Places To Live In California
- 10 Worst Places To Live In California
How do you decide where the best place is to catch Pokemon?
In order to rank the best places in California in which to catch ’em all, we had to determine which cities, towns and villages in California have the most places to find Pokemon.
So we scraped the internet for those criteria, and it spit out the answer. Like magic.
How we crunched the numbers
We threw a lot of criteria at this one in order to get the best, most complete results possible. Using Google Maps, this is the criteria we used:
- Number of parks per capita
- Number of museums per capita
- Number of churches per capita
- Number of memorials and public gathering places per capita
If you’d like to see the complete list of cities, scroll to the bottom of this post to see a chart of the top cities.
Note: When measuring the locations listed above, we measured the locations within a short drive of the center of each place in California.
1. Villa Park
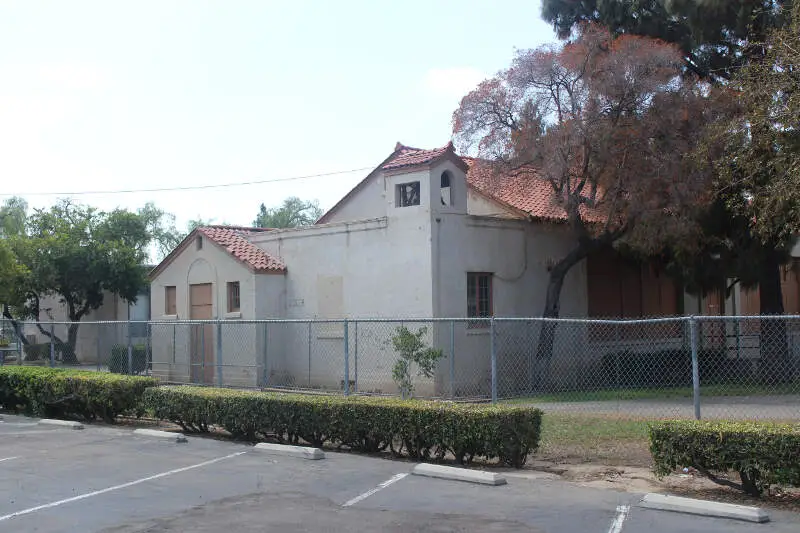
Population: 5,911
Parks Per 1,000 People: 10.15
Museums Per 1,000 People: 4.4
Churches Per 1,000 People: 10.15
Public Gathering Places Per 1,000 People: 4.57
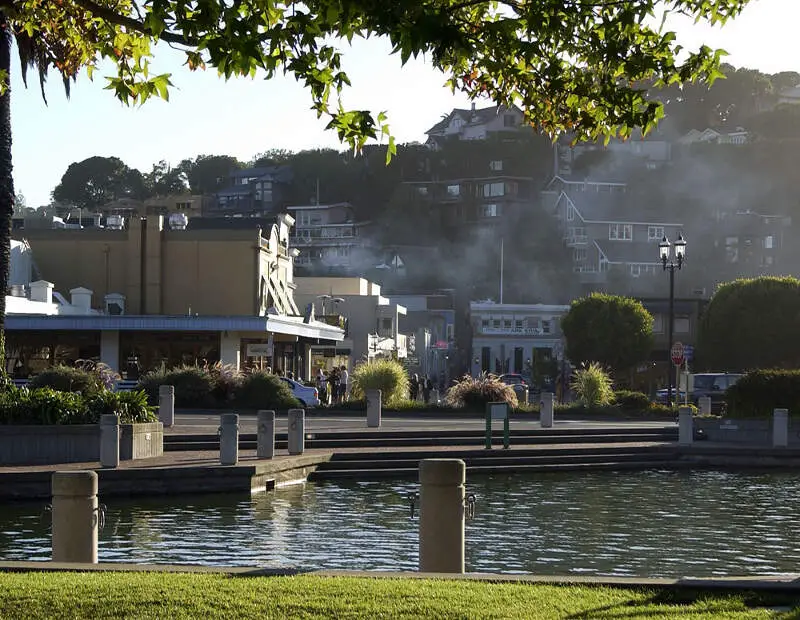
2. Sausalito
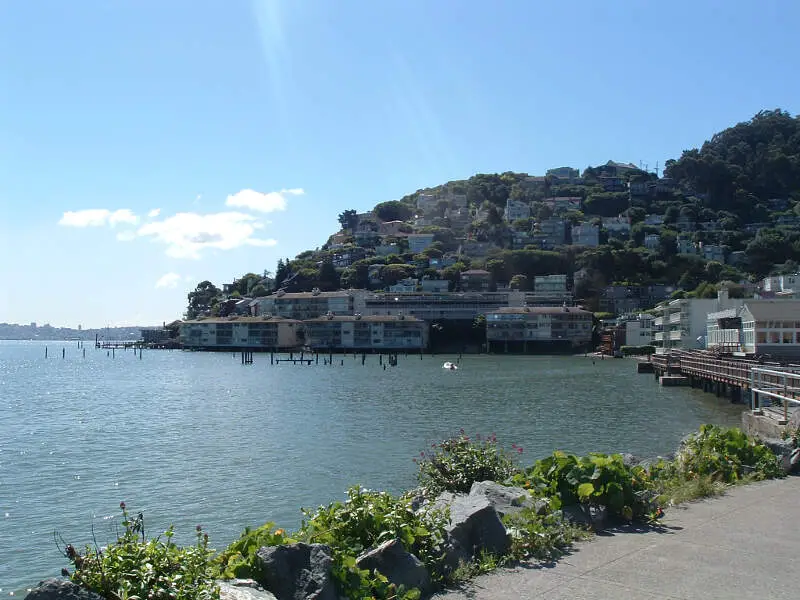
Population: 7,043
Parks Per 1,000 People: 8.52
Museums Per 1,000 People: 5.68
Churches Per 1,000 People: 8.52
Public Gathering Places Per 1,000 People: 4.83
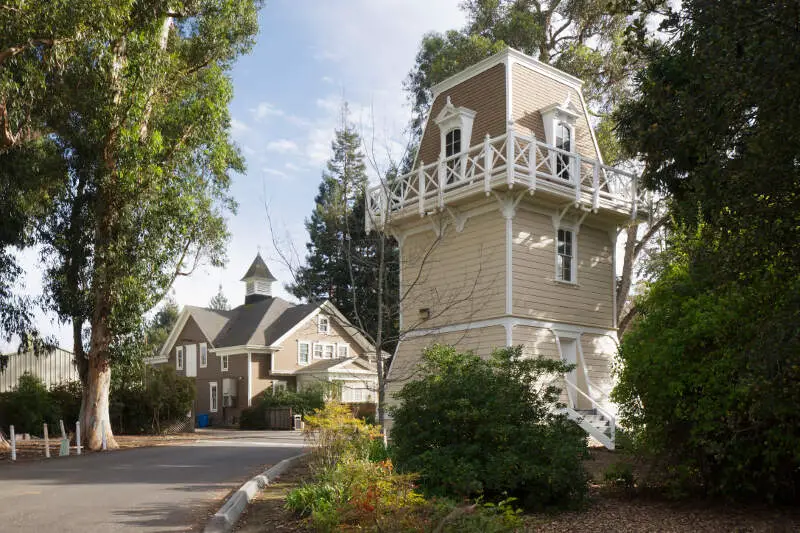
3. Woodside
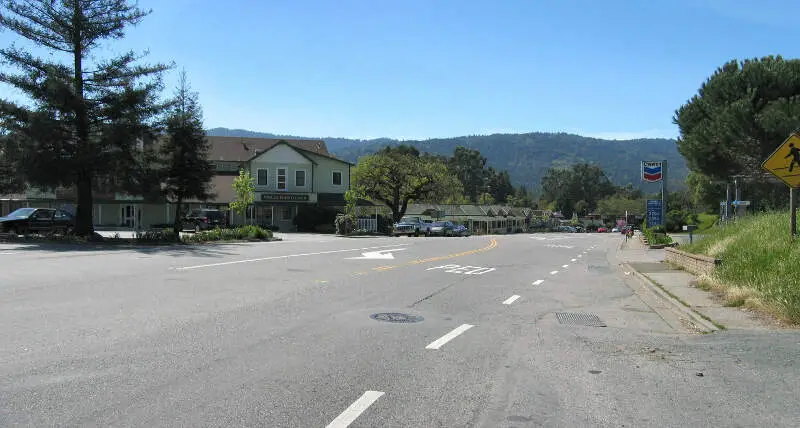
Population: 5,427
Parks Per 1,000 People: 11.06
Museums Per 1,000 People: 2.58
Churches Per 1,000 People: 11.06
Public Gathering Places Per 1,000 People: 3.87
4. La Habra Heights
Population: 5,398
Parks Per 1,000 People: 11.12
Museums Per 1,000 People: 2.22
Churches Per 1,000 People: 11.12
Public Gathering Places Per 1,000 People: 2.96
5. Rolling Hills Estates
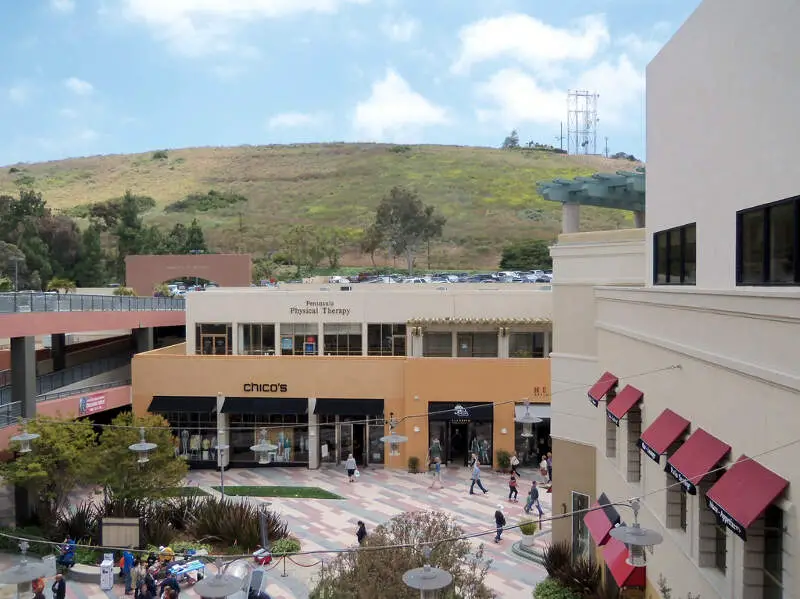
Population: 8,184
Parks Per 1,000 People: 7.33
Museums Per 1,000 People: 3.67
Churches Per 1,000 People: 7.33
Public Gathering Places Per 1,000 People: 5.99
6. Tiburon
Population: 9,100
Parks Per 1,000 People: 6.59
Museums Per 1,000 People: 4.4
Churches Per 1,000 People: 6.48
Public Gathering Places Per 1,000 People: 4.18
7. Atherton
Population: 7,034
Parks Per 1,000 People: 8.53
Museums Per 1,000 People: 2.99
Churches Per 1,000 People: 8.53
Public Gathering Places Per 1,000 People: 2.42
8. Loomis
Population: 6,589
Parks Per 1,000 People: 9.11
Museums Per 1,000 People: 3.04
Churches Per 1,000 People: 9.11
Public Gathering Places Per 1,000 People: 1.97
9. Emeryville
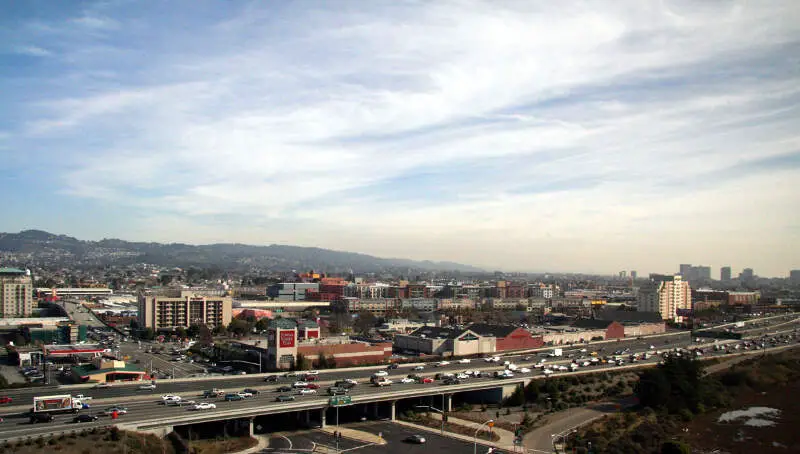
Population: 10,497
Parks Per 1,000 People: 5.72
Museums Per 1,000 People: 5.72
Churches Per 1,000 People: 5.72
Public Gathering Places Per 1,000 People: 3.91
10. Indian Wells
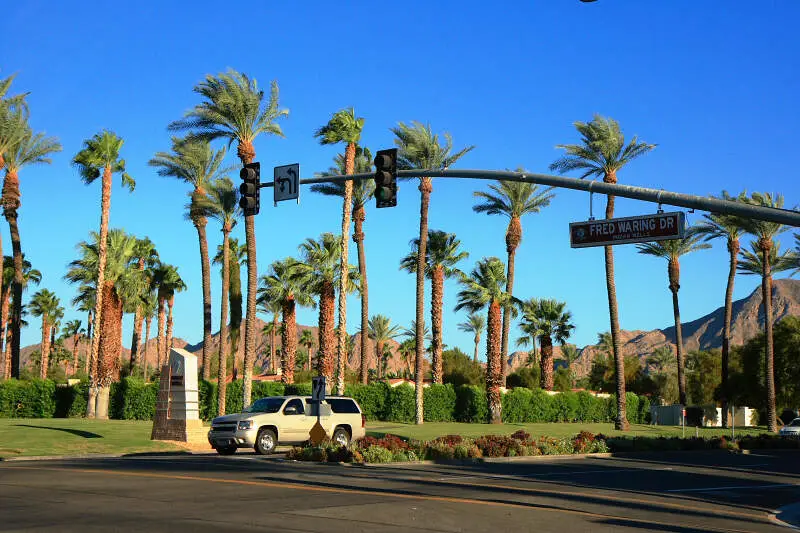
Population: 5,089
Parks Per 1,000 People: 11.79
Museums Per 1,000 People: 1.77
Churches Per 1,000 People: 11.79
Public Gathering Places Per 1,000 People: 1.57
There You Have It
If you’re looking at communities in California where you have a much higher chance of catching Pokemon, this is an accurate list.
If you’re also curious enough, here’s how the larger cities in California with the most reliable locations to catch a Pokemon rank, according to science.
- Long Beach (Photos)
- Oakland (Photos)
- Anaheim (Photos)
- San Diego (Photos)
- Sacramento (Photos)
For more California reading, check out:
- 10 Best Places To Live In California
- 10 Worst Places To Live In California
- 10 Most Diverse Cities In California
Detailed List Of The Best Places In California To Catch Pokemon
| Rank | City |
|---|---|
| 1 | Villa Park |
| 2 | Sausalito |
| 3 | Woodside |
| 4 | La Habra Heights |
| 5 | Rolling Hills Estates |
| 6 | Tiburon |
| 7 | Atherton |
| 8 | Loomis |
| 9 | Emeryville |
| 10 | Indian Wells |
| 11 | Signal Hill |
| 12 | Corte Madera |
| 13 | Piedmont |
| 14 | Fowler |
| 15 | Hughson |
| 16 | Los Alamitos |
| 17 | Calistoga |
| 18 | Commerce |
| 19 | Los Altos Hills |
| 20 | Grand Terrace |
| 21 | Mill Valley |
| 22 | Sebastopol |
| 23 | Escalon |
| 24 | Cotati |
| 25 | Hawaiian Gardens |
| 26 | Hillsborough |
| 27 | La Palma |
| 28 | Fairfax |
| 29 | Palos Verdes Estates |
| 30 | San Marino |
| 31 | Sierra Madre |
| 32 | Calimesa |
| 33 | Moraga |
| 34 | El Segundo |
| 35 | Guadalupe |
| 36 | Clayton |
| 37 | Albany |
| 38 | Pismo Beach |
| 39 | Orinda |
| 40 | Santa Fe Springs |
| 41 | Laguna Woods |
| 42 | Lomita |
| 43 | Artesia |
| 44 | Canyon Lake |
| 45 | Larkspur |
| 46 | Capitola |
| 47 | Cudahy |
| 48 | Solana Beach |
| 49 | South El Monte |
| 50 | Shasta Lake |
| 51 | El Cerrito |
| 52 | Marysville |
| 53 | Hermosa Beach |
| 54 | Pinole |
| 55 | Coronado |
| 56 | Pacific Grove |
| 57 | Lemon Grove |
| 58 | South Pasadena |
| 59 | Scotts Valley |
| 60 | Maywood |
| 61 | Ripon |
| 62 | Grass Valley |
| 63 | Farmersville |
| 64 | Livingston |
| 65 | San Anselmo |
| 66 | Lafayette |
| 67 | Half Moon Bay |
| 68 | Anderson |
| 69 | Loma Linda |
| 70 | Seal Beach |
| 71 | Sonoma |
| 72 | Laguna Beach |
| 73 | Orange Cove |
| 74 | Port Hueneme |
| 75 | Fort Bragg |
| 76 | Millbrae |
| 77 | Gridley |
| 78 | West Hollywood |
| 79 | Kingsburg |
| 80 | Oroville |
| 81 | San Fernando |
| 82 | St. Helena |
| 83 | Beverly Hills |
| 84 | Belmont |
| 85 | Rancho Mirage |
| 86 | Lawndale |
| 87 | Agoura Hills |
| 88 | Bell |
| 89 | Exeter |
| 90 | Riverbank |
| 91 | Oakdale |
| 92 | Auburn |
| 93 | Solvang |
| 94 | Walnut |
| 95 | Saratoga |
| 96 | Fillmore |
| 97 | Healdsburg |
| 98 | San Pablo |
| 99 | Ione |
| 100 | San Carlos |
