California is such a great place to live that the best places to live in California would probably qualify as some of the best places to live in the world.
So what does it take to earn a place in the state’s upper echelon of cities? We looked at several factors from the FBI, Census, and Zillow with Saturday Night Science. The best places in California all share one attribute — wealth.
The places that made the list of the best in California are primarily around San Francisco in Silicon Valley. While housing certainly isn’t cheap, big tech salaries might make it possible for you to afford a place to live.
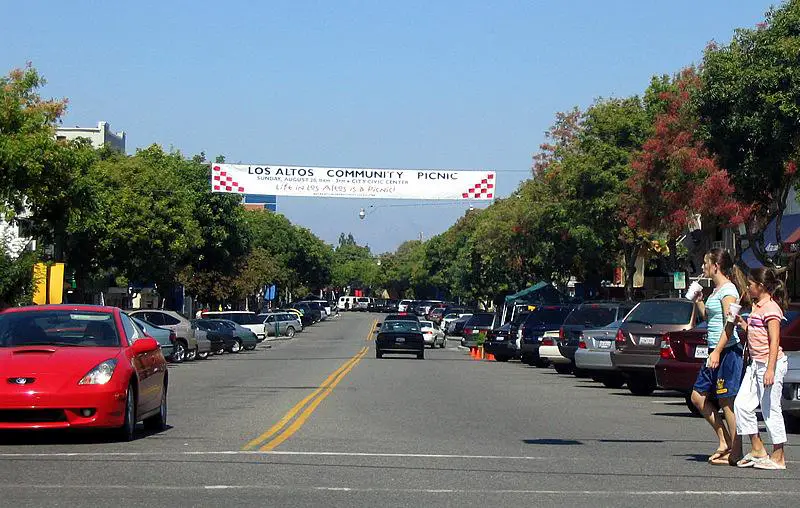
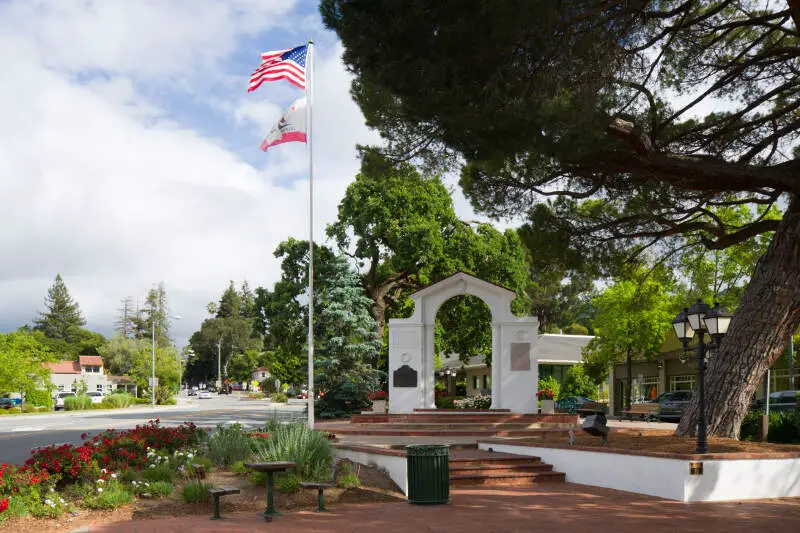
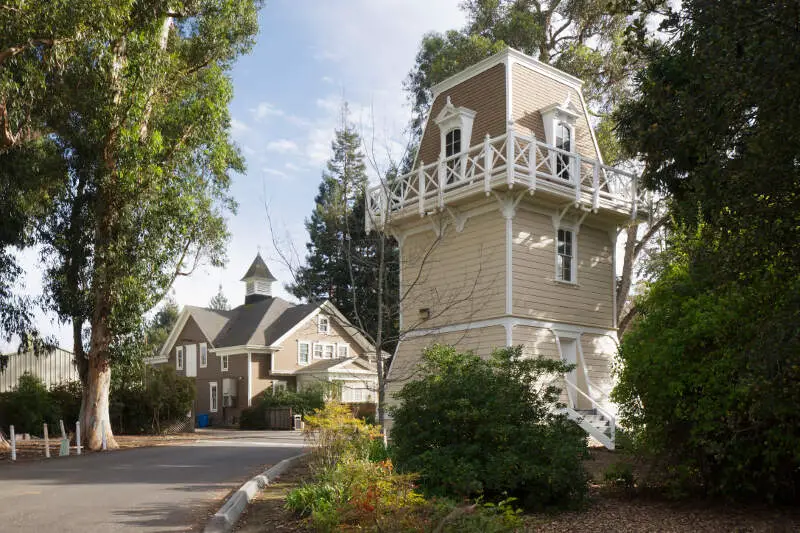
$250,001 median income · $4,713,315 median home · #1 best place in California
Los Altos, one of many Silicon Valley representatives to make the cut this year. Unsurprisingly, residents of Los Altos are highly educated, with over half of folks having a master’s degree or higher. Bigger degrees lead to bigger paychecks, which leaves the residents of Los Altos in the comfortable position of earning around $250,001/year. So, while the $4,713,315 price tag on homes in Los Altos is quite expensive, the overall cost of living is actually quite reasonable.
If you want to settle down in Los Altos for good, you’re in luck because the local schools scored an average of 9/10 on GreatSchools. On top of that, Los Altos has the 15th lowest rate of violent crime in California.
With all of these awesome features, it’s unsurprising that the Los Altos Farmer’s Market is one of the city’s top attractions. If your shopping needs fall outside the purview of a farmer’s market, Santana Row in San Jose is just a fifteen minute drive away.
Data | Crime | Cost of living | Movers
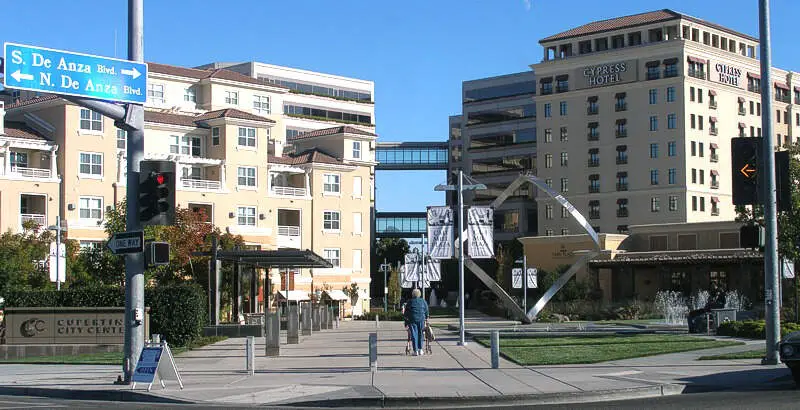
$234,707 median income · $3,189,452 median home · #2 best place in California
Ever wonder why Cupertino is the default option for weather on the iPhone? That’s because, in addition to being the 2nd best place to live in California, Cupertino is also the home of Apple’s Headquarters. Being the hub of a tech behemoth like Apple, it’s no surprise that Cupertino’s population of 58,566 is hyper-educated, with more than 40% of residents having a master’s, Ph.D, or professional degree.
All that extra time in school really pays off, because folks in Cupertino enjoy a median household income of $234,707/year, which you’ll need to pay off the $3,189,452 mortgage. Only 3.2% of people are on SNAP and 1.8% of people are without health insurance, so you know the residents of Cupertino aren’t struggling to get by.
We all know you can’t really consider yourself a part of the elite unless you’re a wine snob, so be sure to get in on the culture at one of the several vineyards in the Cupertino area.
Data | Crime | Cost of living | Movers
$250,001 median income · $4,189,623 median home · #3 best place in California
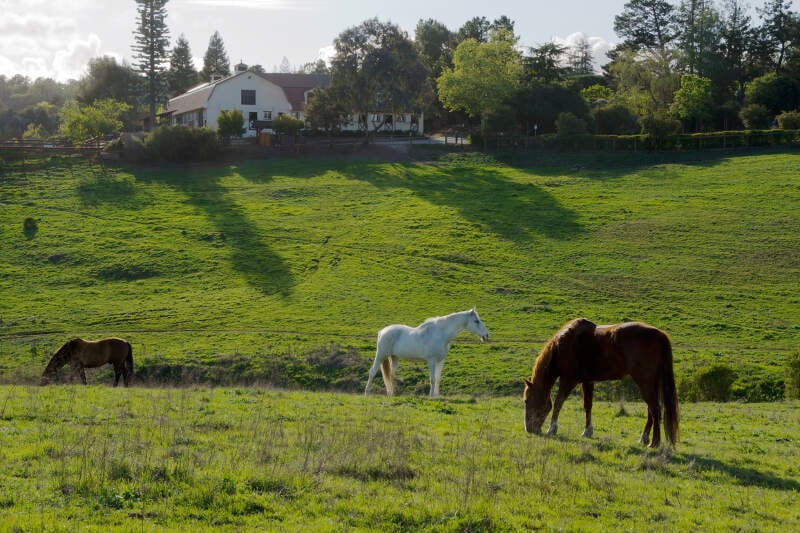
Saratoga is a city of 30,319 located on the western side of the Santa Clara Valley. Of all the San Jose suburbs, Saratoga is the closest to Big Basin Redwoods State Park, California’s oldest state park and home to the largest stand of redwoods south of San Francisco.
Public schools is Saratoga received a 9/10+ on GreatSchools, so you know kids get off to a good start growing up here. Which obviously translates into greater success in later life, seeing as over 40% of residents have a master’s degree or higher. One good thing leads to another, because residents of Saratoga earn a median household income of $250,001, the 4th highest in Cali.
Add to that the 16th lowest rate of crime statewide and the 9th largest percentage of insured residents, and you’ve got a recipe for the 3rd best place to call home in California.
Data | Crime | Cost of living | Movers
$202,245 median income · $2,343,977 median home · #4 best place in California
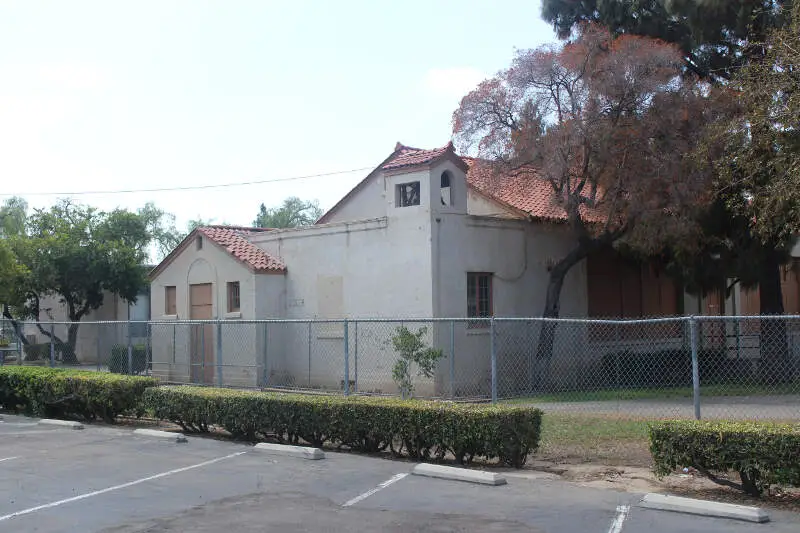
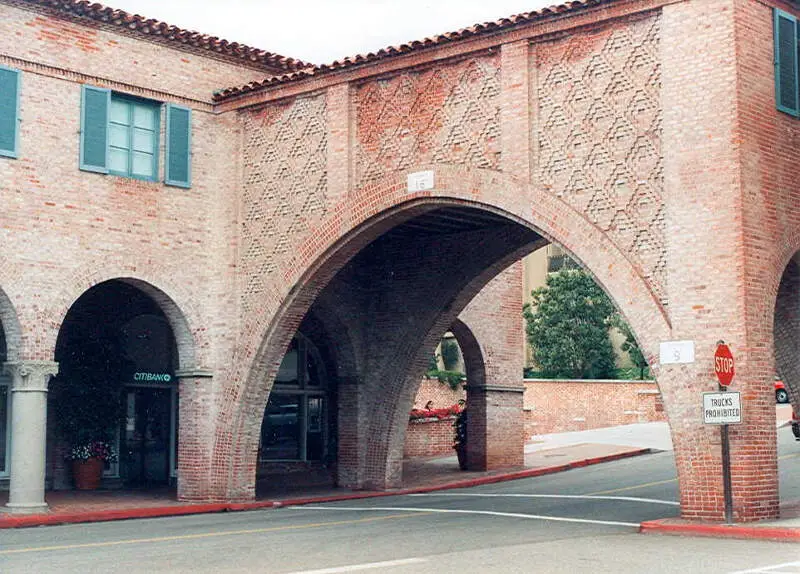
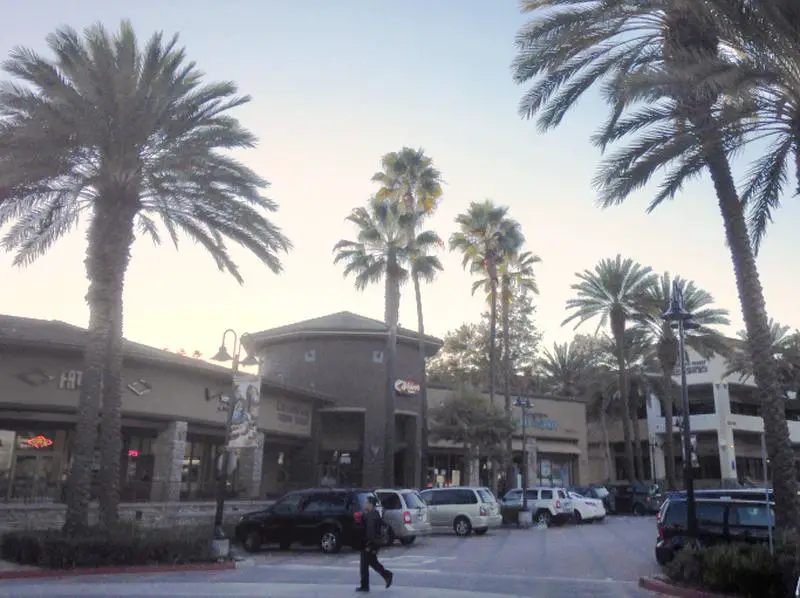
Located in Orange County to the east of Anaheim and north of Santa Ana is our 4th best place to live in California – Villa Park. While the main draw of the town may be its proximity to major cities, it also offers a lot of high quality shopping options in the Towne Centre, restaurants, and local amenities.
But really stands out about Villa Park? The near absence of crime. The city has the 3rd lowest rate of violent crime in the Golden State per the latest FBI data.
Data | Crime | Cost of living | Movers
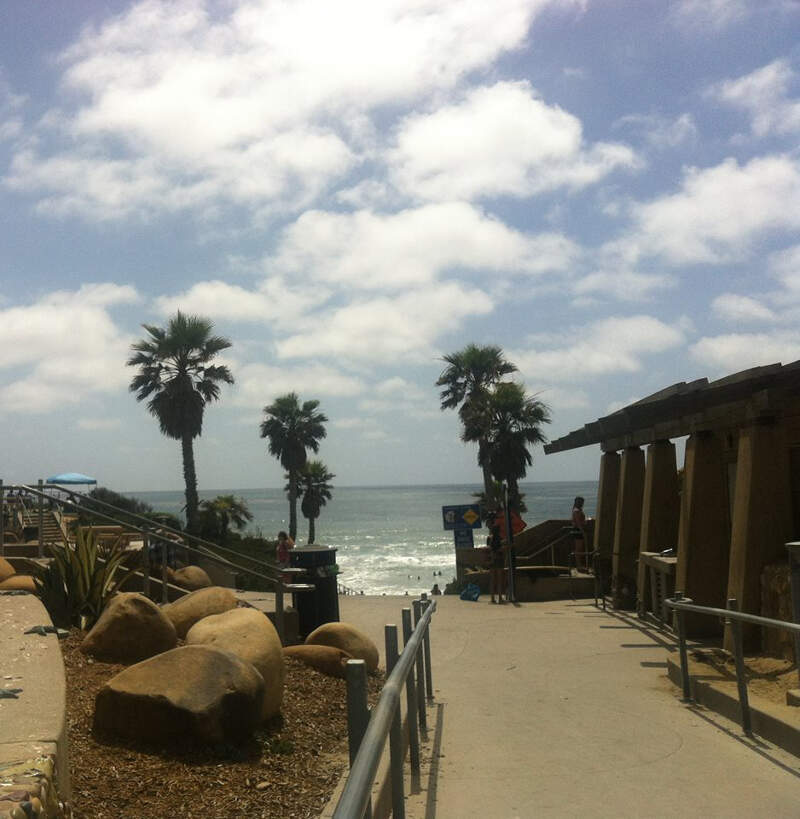
$152,167 median income · $2,183,118 median home · #5 best place in California
Would you guess California’s most walkable beach town ranks 5th among the best places to live in the state? It checks out. The Cedros Avenue Design District puts independent boutiques and galleries within strolling distance, and Fletcher Cove is the park families keep coming back to.
Unemployment sits at 3.5%, poverty at 5.5%, honestly some of the lowest numbers on this list. Pretty much nonexistent. Median income clears $152,167 and home values follow at $2,183,118, which tracks for a San Diego coastal zip nobody’s calling a bargain.
Not bad for one of the best small towns in California to call home.
Data | Crime | Cost of living | Movers
$250,001 median income · $7,890,841 median home · #6 best place in California
We’re returning to Silicon Valley to arrive at the 6th best place to live in California for 2026, Atherton.
Atherton is right outside of Palo Alto, so if you’ve ever dreamed of taking classes at the prestigious Stanford University, you’re in for a treat.
Atherton enjoys the shortest commute time on this list, with residents having to spend 23 minutes to get to and from work each day. Atherton also has the lowest rate of food stamp recipients on this list. That probably has something to do with Atherton’s ridiculously high median household income of $250,001/year, which ties for the 4th highest in California.
Data | Crime | Cost of living | Movers
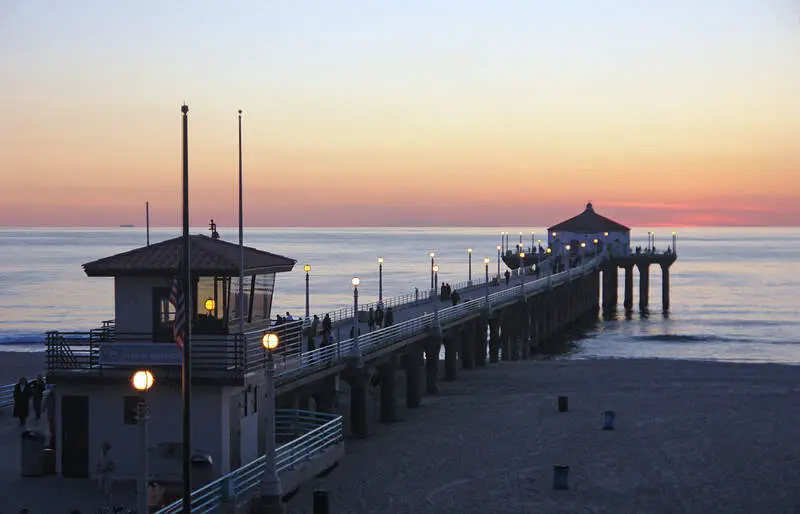
$204,306 median income · $3,227,202 median home · #7 best place in California
If you can swing the sticker shock, Manhattan Beach delivers one of the best California addresses money can buy. This is the South Bay at its peak. It offers $3,227,202 median homes, $204,306 median income, and a quiet community where 3.8% unemployment and 4.5% poverty make instability feel like someone else’s problem.
Walk the Strand boardwalk. Or watch the sport Manhattan Beach helped invent. Beach volleyball got its competitive start right here, and the Manhattan Beach Open has been running since 1960; for a place to live in California, that’s a pretty good legacy.
Data | Crime | Cost of living | Movers
$242,014 median income · $2,763,820 median home · #8 best place in California
Next on our list of the best places to live in California is Palos Verdes Estates, a city of 12,925 located just south of Los Angeles. For some, it’ll be enough to mention that Disneyland is just a short drive away to convince them that moving to Palos Verdes Estates is a good course of action.
But if even if you’re not into Mickey and the gang, there’s plenty to love right in your neighborhood, like having the Palos Verdes Estates Shoreline Preserve Beach, a rocky beach and bluff, to visit year-round.
Palos Verdes is exceptionally safe, with the 25th lowest overall crime rate in California. That may have something to do with how educated residents are, considering that over 30% of people have a master’s degree or higher.
More degrees lead to bigger paychecks, and Palos Verdes Estates residents prove that with a median household income of $242,014. Which is kind of essential when your typical Palos Verdes Estates home sells for $2,763,820. Unemployment is at rock-bottom levels thanks to low levels of high school dropouts. In fact, GreatSchools gave Palos Verdes Estates schools an average score of 8.5/10.
Data | Crime | Cost of living | Movers
$142,439 median income · $1,012,225 median home · #9 best place in California
We’re departing from Silicon Valley and heading towards Los Angeles’ Orange County to arrive at Aliso Viejo, the 9th best place to live in California. Aliso Viejo is a vibrant, youthful city where the median age is only 39. It’s also the most densely populated city you’ll see on this list.
Aliso Viejo has the 162nd best home price to income ratio. That low cost of living means you won’t have to break the bank to enjoy yourself here. As a bonus, you won’t have any trouble getting friends and family to come visit you in Aliso Viejo, because Disneyland is just a hop, skip, and jump away.
Data | Crime | Cost of living | Movers
$250,001 median income · $6,102,345 median home · #10 best place in California
With over 50% of residents holding a master’s degree or higher, Los Altos Hills is one of California’s best places to live. The unemployment rate in Los Altos Hills is a mere 3.5%, the 26th lowest of anywhere on this list.
Which makes sense when you consider that such a highly educated population drives strong income. Folks in Los Altos Hills earn around $250,001/year, the 4th highest in California.
Los Altos Hills has the 3rd lowest overall crime rate in the state, about 75% below the national average.
Data | Crime | Cost of living | Movers
The receipts
Compare the top ten
Pick a metric. The bars rescale. The red line is California’s statewide median.
California statewide median: $99,122
California statewide median: $774,582
California statewide median: 6.6%
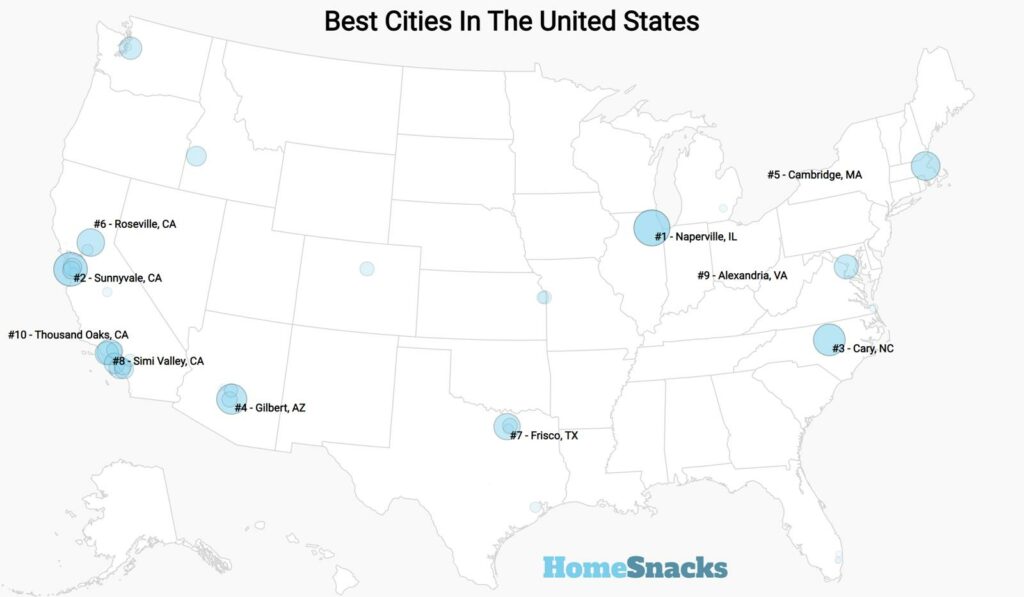
On the map
Mapping The Best And Worst Places To Live in California
Saturday Night Science
Methodology: How We Calculated The Best Cities To Live In California
Before we even started to collect data on the best places to live in California, we had to answer a tough question: Is it fair to pit cities with populations over 100,000 against places with a population of 18?
We firmly decided no, that just isn’t fair.
So, to create our ranking, we broke the best places to live into three tiers:
- Cities — Populations over 5,000
- Towns — Populations between 1,000 and 5,000
- Small Towns — Populations below 1,000
We then decided no matter how much anyone loves their town, the best cities to live in California have more of everything, and therefore, you need over 5,000 people to truly be ‘the best.’
Now that we had our set of the best possible cities, it was time to rank them using Saturday Night Science.
We ranked each place in California across a number of criteria from one to 411, with one being the best.
We then took the average rank across all criteria, crowning the city posting the lowest overall score, the “Best Place To Live In California.”
The criteria we looked to determine the best places were:
- Median Home Values
- Median Income
- Population Density (Higher is better)
- Unemployment Rate
- Commute Time
- Crime
- Education Levels
- Health Insurance Coverage
- Poverty rates
Sources of criteria include the New Census Data, FBI Crime Data, and Zillow. We updated this article for 2026. This report is our eleventh time ranking California’s best places to live.
If your city or town isn’t among the top 10, jump down to the bottom of the post to see a detailed chart of the best places in California. Otherwise, buckle up for a ride down good living lane with Los Altos at the end of the cul-de-sac.
The full plate
Best Places To Live In California Table
Click any column to sort. Search by city name.
| Rank | City | Best Score | Population | Unemployment Rate | Home Value | Median Income | Rent | Total Crime /100k |
|---|---|---|---|---|---|---|---|---|
| 1 | Los Altos | 50.15 | 30,698 | 4.8% | $4,713,315 | $250,001 | 1,241 | |
| 2 | Cupertino | 56.75 | 58,566 | 4.0% | $3,189,452 | $234,707 | 1,615 | |
| 3 | Saratoga | 57.65 | 30,319 | 4.0% | $4,189,623 | $250,001 | 663 | |
| 4 | Villa Park | 61.10 | 5,748 | 2.9% | $2,343,977 | $202,245 | 731 | |
| 5 | Solana Beach | 65.85 | 12,823 | 3.5% | $2,183,118 | $152,167 | 1,248 | |
| 6 | Atherton | 73.15 | 6,993 | 3.2% | $7,890,841 | $250,001 | 1,330 | |
| 7 | Manhattan Beach | 76.75 | 34,210 | 3.8% | $3,227,202 | $204,306 | 2,567 | |
| 8 | Palos Verdes Estates | 81.05 | 12,925 | 4.7% | $2,763,820 | $242,014 | 781 | |
| 9 | Aliso Viejo | 81.05 | 51,113 | 4.2% | $1,012,225 | $142,439 | 974 | |
| 10 | Los Altos Hills | 81.45 | 8,377 | 3.5% | $6,102,345 | $250,001 | 394 | |
| 11 | Sierra Madre | 84.50 | 10,940 | 2.6% | $1,437,492 | $143,547 | 777 | |
| 12 | Piedmont | 85.30 | 10,945 | 1.5% | $2,459,056 | $250,001 | 3,307 | |
| 13 | San Marino | 87.70 | 12,216 | 5.3% | $2,837,216 | $214,167 | 1,171 | |
| 14 | Orinda | 90.75 | 19,514 | 3.4% | $1,985,117 | $250,001 | 928 | |
| 15 | Sunnyvale | 91.30 | 154,236 | 4.5% | $2,168,909 | $186,170 | 2,107 | |
| 16 | Newport Beach | 91.75 | 83,845 | 4.3% | $3,625,146 | $156,867 | 2,073 | |
| 17 | Lafayette | 91.80 | 25,285 | 4.3% | $1,934,581 | $228,250 | 1,329 | |
| 18 | Pacific Grove | 91.90 | 14,951 | 5.5% | $1,405,345 | $106,065 | 1,030 | |
| 19 | Los Gatos | 92.85 | 32,786 | 5.0% | $2,705,289 | $217,554 | 1,534 | |
| 20 | Hillsborough | 92.90 | 11,099 | 7.0% | $5,279,135 | $250,001 | 748 | |
| 21 | Dana Point | 94.80 | 32,790 | 4.0% | $1,736,393 | $141,520 | 1,046 | |
| 22 | Danville | 94.85 | 43,401 | 5.6% | $1,908,521 | $232,216 | 638 | |
| 23 | Mission Viejo | 96.50 | 92,151 | 5.2% | $1,229,743 | $136,123 | 1,251 | |
| 24 | San Ramon | 96.65 | 85,993 | 5.2% | $1,543,534 | $196,161 | 1,178 | |
| 25 | Rancho Santa Margarita | 96.85 | 46,990 | 4.1% | $1,029,346 | $152,560 | 587 | |
| 26 | Rancho Palos Verdes | 98.25 | 40,864 | 5.5% | $1,824,948 | $179,623 | 937 | |
| 27 | Mountain View | 98.35 | 83,732 | 3.7% | $2,037,086 | $189,917 | 2,996 | |
| 28 | Encinitas | 100.60 | 61,480 | 4.5% | $1,889,066 | $162,229 | 1,137 | |
| 29 | Pacifica | 101.35 | 37,261 | 3.9% | $1,284,847 | $160,523 | 1,393 | |
| 30 | St. Helena | 101.50 | 5,318 | 4.6% | $1,633,318 | $148,750 | 903 | |
| 31 | Yorba Linda | 101.90 | 67,170 | 4.7% | $1,419,513 | $157,582 | 837 | |
| 32 | Laguna Beach | 103.30 | 22,710 | 5.0% | $2,949,835 | $143,843 | 1,088 | |
| 33 | Agoura Hills | 103.75 | 19,721 | 5.2% | $1,259,726 | $171,302 | 994 | |
| 34 | Palo Alto | 103.90 | 67,237 | 3.9% | $3,722,200 | $231,101 | 3,141 | |
| 35 | Menlo Park | 107.05 | 32,727 | 4.8% | $2,865,159 | $210,025 | 1,907 | |
| 36 | Belmont | 108.05 | 27,337 | 7.2% | $2,332,686 | $205,297 | 1,383 | |
| 37 | Lake Forest | 108.35 | 86,281 | 4.9% | $1,208,686 | $135,175 | 970 | |
| 38 | Albany | 108.55 | 19,414 | 3.1% | $1,261,177 | $144,107 | 2,539 | |
| 39 | Mill Valley | 109.50 | 14,012 | 8.8% | $2,073,166 | $206,212 | 1,071 | |
| 40 | Laguna Niguel | 109.50 | 64,139 | 7.1% | $1,499,546 | $140,452 | 1,003 | |
| 41 | Arroyo Grande | 110.25 | 18,372 | 2.9% | $1,044,036 | $102,553 | 942 | |
| 42 | Hermosa Beach | 110.65 | 19,063 | 5.4% | $2,245,351 | $166,442 | 2,738 | |
| 43 | Santa Clara | 111.75 | 130,256 | 5.1% | $1,782,192 | $178,958 | 2,718 | |
| 44 | Poway | 112.40 | 48,713 | 5.2% | $1,230,064 | $148,359 | 704 | |
| 45 | Moraga | 113.25 | 16,769 | 6.4% | $1,666,830 | $216,193 | 567 | |
| 46 | Coronado | 114.15 | 19,015 | 4.7% | $2,508,031 | $134,534 | 1,899 | |
| 47 | Tiburon | 114.45 | 9,012 | 10.5% | $3,020,895 | $232,969 | 1,132 | |
| 48 | Redondo Beach | 116.30 | 69,291 | 5.5% | $1,500,192 | $150,245 | 2,725 | |
| 49 | Clayton | 116.80 | 10,937 | 6.7% | $1,057,924 | $175,707 | 576 | |
| 50 | Scotts Valley | 117.00 | 12,044 | 2.9% | $1,260,978 | $143,750 | 1,860 | |
| 51 | South Pasadena | 117.15 | 26,068 | 5.1% | $1,692,678 | $127,175 | 2,635 | |
| 52 | Rolling Hills Estates | 117.35 | 8,131 | 7.5% | $1,901,413 | $191,895 | 1,611 | |
| 53 | San Clemente | 117.55 | 63,273 | 4.6% | $1,721,005 | $140,062 | 1,415 | |
| 54 | South San Francisco | 117.90 | 64,305 | 2.8% | $1,242,214 | $136,578 | 1,799 | |
| 55 | Rocklin | 118.75 | 73,327 | 4.5% | $692,668 | $124,168 | 1,079 | |
| 56 | San Mateo | 118.75 | 103,105 | 4.6% | $1,686,905 | $153,504 | 2,061 | |
| 57 | Dublin | 119.35 | 70,803 | 3.8% | $1,305,295 | $214,385 | 1,993 | |
| 58 | Windsor | 119.70 | 26,081 | 3.6% | $804,764 | $133,979 | 951 | |
| 59 | Ripon | 120.75 | 16,201 | 2.7% | $682,800 | $133,380 | 1,025 | |
| 60 | Pleasanton | 121.25 | 76,960 | 4.8% | $1,601,646 | $190,124 | 1,701 | |
| 61 | La Palma | 124.00 | 15,272 | 3.9% | $1,203,550 | $117,989 | 1,977 | |
| 62 | San Bruno | 124.25 | 42,307 | 5.0% | $1,327,402 | $141,272 | 2,130 | |
| 63 | San Carlos | 125.15 | 29,614 | 5.0% | $2,459,877 | $237,470 | 50,244 | |
| 64 | Sausalito | 125.35 | 7,141 | 8.0% | $1,505,307 | $182,357 | 1,764 | |
| 65 | Camarillo | 126.20 | 70,186 | 5.5% | $924,929 | $113,428 | 1,299 | |
| 66 | Burlingame | 126.60 | 30,525 | 5.7% | $2,761,630 | $174,000 | 2,133 | |
| 67 | La Habra Heights | 126.75 | 5,478 | 2.8% | $1,399,870 | $179,583 | 821 | |
| 68 | Moorpark | 127.50 | 35,854 | 5.1% | $939,094 | $148,480 | 800 | |
| 69 | Cotati | 127.75 | 7,489 | 3.6% | $727,231 | $110,750 | 1,228 | |
| 70 | Irvine | 127.85 | 311,690 | 5.9% | $1,557,982 | $136,719 | 1,498 | |
| 71 | Campbell | 128.50 | 42,781 | 5.0% | $1,977,422 | $145,268 | 3,298 | |
| 72 | Laguna Hills | 129.10 | 30,740 | 6.2% | $1,243,180 | $128,851 | 1,327 | |
| 73 | Milpitas | 130.15 | 78,578 | 4.1% | $1,502,891 | $178,798 | 3,406 | |
| 74 | Livermore | 131.40 | 85,522 | 3.6% | $1,122,823 | $160,775 | 2,434 | |
| 75 | Fountain Valley | 132.40 | 56,258 | 5.6% | $1,394,237 | $115,237 | 1,918 | |
| 76 | Goleta | 132.95 | 32,685 | 4.2% | $1,364,878 | $122,370 | 1,771 | |
| 77 | Santee | 133.15 | 59,332 | 4.7% | $803,482 | $113,394 | 826 | |
| 78 | Carpinteria | 134.05 | 13,036 | 3.6% | $1,506,926 | $100,658 | 1,519 | |
| 79 | Carlsbad | 134.45 | 114,373 | 5.5% | $1,370,649 | $142,748 | 1,690 | |
| 80 | Sonoma | 134.55 | 10,670 | 5.7% | $943,021 | $98,527 | 1,321 | |
| 81 | Thousand Oaks | 135.05 | 125,205 | 5.4% | $1,049,634 | $135,603 | 1,097 | |
| 82 | Eastvale | 136.89 | 70,633 | 4.7% | $949,255 | $160,069 | 1,824 | |
| 83 | Simi Valley | 136.90 | 125,634 | 5.0% | $844,909 | $122,081 | 1,045 | |
| 84 | Lincoln | 137.20 | 52,956 | 4.2% | $639,029 | $111,990 | 697 | |
| 85 | Benicia | 137.40 | 26,749 | 4.5% | $781,134 | $121,204 | 1,140 | |
| 86 | Corte Madera | 138.00 | 10,077 | 4.2% | $1,838,958 | $232,763 | 2,945 | |
| 87 | Morgan Hill | 138.70 | 45,425 | 5.3% | $1,356,869 | $163,920 | 1,653 | |
| 88 | Fremont | 138.90 | 228,295 | 4.7% | $1,543,132 | $181,506 | 2,485 | |
| 89 | San Juan Capistrano | 139.40 | 35,095 | 3.6% | $1,342,011 | $129,457 | 1,225 | |
| 90 | Folsom | 139.40 | 83,916 | 6.3% | $763,784 | $139,804 | 1,679 | |
| 91 | Larkspur | 141.15 | 12,854 | 4.4% | $2,129,545 | $140,417 | 2,945 | |
| 92 | La Mirada | 142.70 | 47,180 | 3.9% | $887,479 | $109,288 | 1,865 | |
| 93 | Cypress | 142.80 | 49,498 | 5.4% | $1,085,691 | $130,215 | 1,832 | |
| 94 | Huntington Beach | 143.85 | 195,240 | 5.4% | $1,366,658 | $120,919 | 2,138 | |
| 95 | Martinez | 144.15 | 36,903 | 5.8% | $773,745 | $127,355 | 1,474 | |
| 96 | Cloverdale | 144.30 | 8,886 | 2.8% | $636,216 | $117,177 | 1,092 | |
| 97 | Canyon Lake | 144.95 | 11,119 | 4.3% | $704,581 | $126,926 | 800 | |
| 98 | Pismo Beach | 146.65 | 8,014 | 4.4% | $1,123,130 | $118,072 | 2,346 | |
| 99 | El Segundo | 146.75 | 16,769 | 6.0% | $1,759,408 | $150,737 | 5,773 | |
| 100 | Orange | 147.05 | 138,266 | 4.9% | $1,143,788 | $117,113 | 1,511 |
Source: U.S. Census ACS 2020-2024, FBI UCR, Zillow research. 411 places with more than 5,000 residents.
Summary
Summary: The Best Places In California
If you’re looking at areas in California with the best economic situations, where there’s lower than average crime, and a lot to do, this is an accurate list.
The best places to live in California are Los Altos, Cupertino, Saratoga, Villa Park, Solana Beach, Atherton, Manhattan Beach, Palos Verdes Estates, Aliso Viejo, and Los Altos Hills.
Los Altos made a strong showing to take in the overall number one spot for the best place to live in California for 2026.