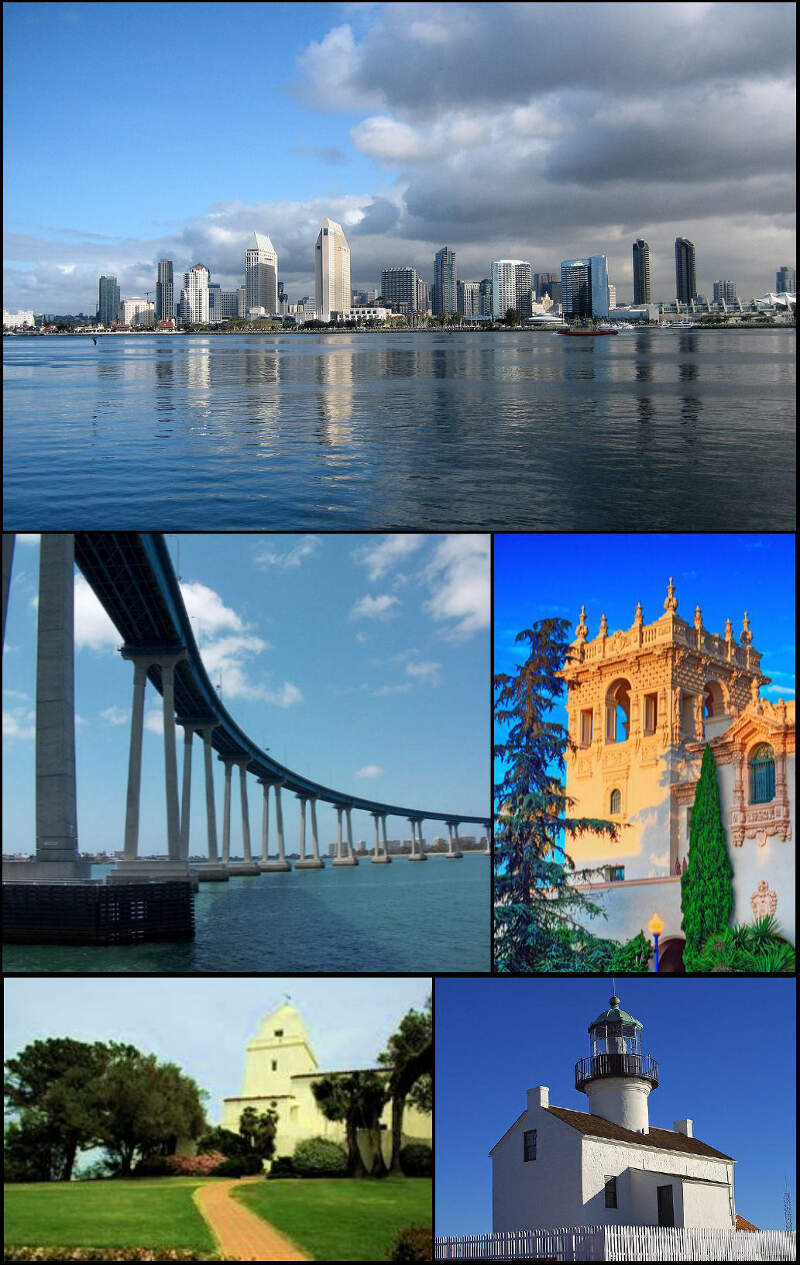
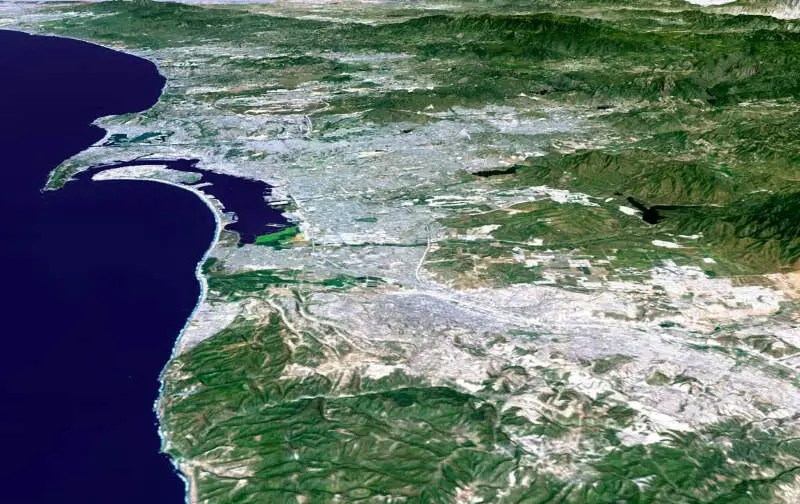
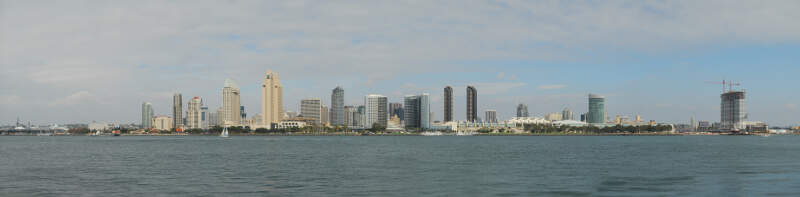
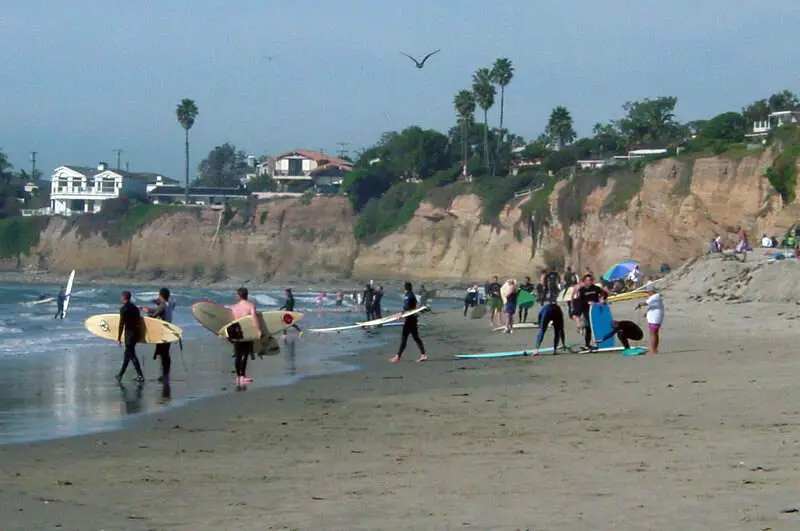
San Diego, CA
Demographics And Statistics
Living In San Diego, California Summary
Life in San Diego research summary. HomeSnacks has been using Saturday Night Science to research the quality of life in San Diego over the past nine years using Census, FBI, Zillow, and other primary data sources. Based on the most recently available data, we found the following about life in San Diego:
The population in San Diego is 1,385,061.
The median home value in San Diego is $981,175.
The median income in San Diego is $104,321.
The cost of living in San Diego is 170 which is 1.7x higher than the national average.
The median rent in San Diego is $2,223.
The unemployment rate in San Diego is 5.9%.
The poverty rate in San Diego is 11.1%.
The average high in San Diego is 73.0° and the average low is 51.8°.
San Diego SnackAbility
Overall SnackAbility
San Diego, CA Crime Report
Crime in San Diego summary. We use data from the FBI to determine the crime rates in San Diego. Key points include:
There were 28,923 total crimes in San Diego in the last reporting year.
The overall crime rate per 100,000 people in San Diego is 2,082.3 / 100k people.
The violent crime rate per 100,000 people in San Diego is 412.2 / 100k people.
The property crime rate per 100,000 people in San Diego is 1,670.0 / 100k people.
Overall, crime in San Diego is -1.74% below the national average.
Total Crimes
Below National Average
Crime In San Diego Comparison Table
| Statistic | Count Raw |
San Diego / 100k People |
California / 100k People |
National / 100k People |
|---|---|---|---|---|
| Total Crimes Per 100K | 28,923 | 2,082.3 | 2,564.5 | 2,119.2 |
| Violent Crime | 5,726 | 412.2 | 486.0 | 359.0 |
| Murder | 35 | 2.5 | 4.5 | 5.0 |
| Robbery | 1,075 | 77.4 | 119.1 | 61.0 |
| Aggravated Assault | 4,319 | 310.9 | 325.8 | 256.0 |
| Property Crime | 23,197 | 1,670.0 | 2,078.4 | 1,760.0 |
| Burglary | 2,603 | 187.4 | 305.8 | 229.0 |
| Larceny | 15,100 | 1,087.1 | 1,345.2 | 1,272.0 |
| Car Theft | 5,494 | 395.5 | 427.5 | 259.0 |
San Diego, CA Cost Of Living
Cost of living in San Diego summary. We use data on the cost of living to determine how expensive it is to live in San Diego. Real estate prices drive most of the variance in cost of living around California. Key points include:
The cost of living in San Diego is 170 with 100 being average.
The cost of living in San Diego is 1.7x higher than the national average.
The median home value in San Diego is $981,175.
The median income in San Diego is $104,321.
San Diego's Overall Cost Of Living
Higher Than The National Average
Cost Of Living In San Diego Comparison Table
| Living Expense | San Diego | California | National Average | |
|---|---|---|---|---|
| Overall | 170 | 141 | 100 | |
| Services | 115 | 110 | 100 | |
| Groceries | 116 | 112 | 100 | |
| Health | 106 | 110 | 100 | |
| Housing | 296 | 195 | 100 | |
| Transportation | 127 | 125 | 100 | |
| Utilities | 105 | 128 | 100 | |
San Diego, CA Weather
The average high in San Diego is 73.0° and the average low is 51.8°.
There are 24.3 days of precipitation each year.
Expect an average of 13.2 inches of precipitation each year with 1.2 inches of snow.
| Stat | San Diego |
|---|---|
| Average Annual High | 73.0 |
| Average Annual Low | 51.8 |
| Annual Precipitation Days | 24.3 |
| Average Annual Precipitation | 13.2 |
| Average Annual Snowfall | 1.2 |
Average High
Days of Rain
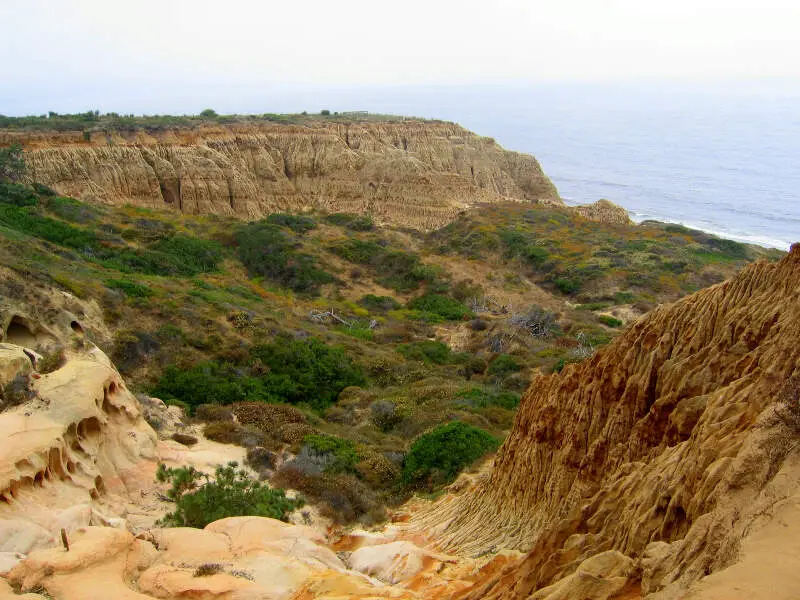
San Diego, CA Photos


8 Reviews & Comments About San Diego
/5

HomeSnacks User - 2018-07-13 17:44:23.429055
San Diego is beautfiul!!!! Beaches are a real treat and the carne asada is to die for!
I don't like how packed the beaches get and parking is a joke! You have to arrive very early to find parking at Mission Beach.
HomeSnacks User - 2018-07-14 23:52:48.687617
San Diego has the best weather in all of the USA. The oceans are a thing of beauty and the outdoor activities are perfect for any outdoor enthusiast. There is always a place to go and always something to do. There are a vast amount of choices for food and beverages in all the different neighborhoods and the ambiance is only enhanced with the ocean views. Most of San Diego is very secure with minimal crime, but there are areas to stay away from especially late at night with the amount of homeless.
Go for a hike one day the beach the next then hang out in downtown, three completely different experiences all within half hour drive. The housing market is difficult, you absolutely pay for the weather as it is very expensive to live in a descent neighborhood.
HomeSnacks User - 2018-07-15 14:29:10.266707
The weather here is beautiful, the downtown area is very cool. There are lots of bars, clubs and high end restuaurants. With the Chargers having moved in recent years, there is a lack of professional sports but there are beaches, the zoo and many other attractions.
Balboa Park and the Zoo are a couple of my favorite places. Balboa Park features many different exhibits which sometimes seasonally change and is a very scenic area of downtown. The Zoo is historic, the best that I have been to and is easily an all day venture, which even then you probably won't get to see all the features.
HomeSnacks User - 2018-07-15 16:57:24.580696
"Rich in History and Rich for Future Growth"
LIttle Italy is by far my favorite Downtown Neighborhood and yes I am biased because I do live here. I have lived here for 6+ years and I love it more each day. I don't know of any other community in San Diego that has its own association. The Little Italy Association has taken charge of this historic neighborhood and is constantly involved in maintaining its roots and heritage while at the same time improving the neighborhood. I love that I can call the association and let them know if there is an issue that has to be addressed such as an outage with a street light or graffiti, they take care of it ASAP. Little Italy is Preserve America Community.
Everyone knows there are no shortage of Italian Restaurants in Little Italy, but we also have some of the best burgers in San Diego as well. You can find those at the Waterfront Bar or at Burger Lounge. There have been a few newer restaurants that do not serve Italian Food and they have been very successful with the locals, because Little Italians need something different once in awhile. Craft and Commerce, Underbelly and El Camino have been welcome additions to the non-italian menus around town.
HomeSnacks User - 2018-08-03 01:52:06.977043
THERE ARE PLENTY OF GREAT THINGS TO DO IN SAN DIEGO. YOU CAN LITERALLY GO TO THE MOUNTAINS, DESERT AND BEACH ALL ON THE SAME DAY. THE SCHOOLS ARE EXCELLENT, THE WEATHER IS GREAT AND THE PEOPLE ARE GOOD
THE BEACH, THE MOUNTAINS, THE WEATHER AND THE PEOPLE IS WHAT STOOD OUT THE MOST ABOUT SAN DIEGO CALIFORNIA. IT IS WORTH THE EXTRA COST OF LIVING TO LIVE THERE BECAUSE IT IS AMERICA'S FINEST CITY INDEED.
HomeSnacks User - 2018-08-05 05:31:28.715340
I'm not sure the hype about San Diego. Sure the weather is nice and not too harsh. Lets me honest there is way too much traffic. The scenery is just OK. Everything is overpriced. There are way better places to visit in the US.
Lots of great taco shops which is a bonus.
HomeSnacks User - 2018-09-10 15:24:18.602779
Overall San Diego is a great place to life with fun activities, great food and weather. Unfortunately, the cost of living is skyrocketing which is making it cost prohibitive. The homeless population and general population growth is a huge negative and traffic is resembling LA.
The San Diego Zoo, beaches, and dining experiences are amazing. Traffic, crime, and homeless population is growing which are the biggest negatives.
HomeSnacks User - 2019-01-08 16:37:13.173331
San Diego is one of my favorite places on earth. It has an incredible tourist life, is fun, entertaining, and relaxing all in the same thing.
The thing that stood out the most was the food. We stayed on Mission Bay and the streets were lined with all different types of food with an incredible view.
San Diego Articles

Rankings for San Diego in California


Locations Around San Diego
Map Of San Diego, CA
Best Places Around San Diego
Bonita, CA
Population 13,336
Santee, CA
Population 59,485
Poway, CA
Population 48,515
Rancho San Diego, CA
Population 22,264
Casa de Oro-Mount Helix, CA
Population 19,651
La Presa, CA
Population 36,669
Encinitas, CA
Population 61,585
Jamul, CA
Population 6,617
Lemon Grove, CA
Population 27,489
Winter Gardens, CA
Population 22,003
San Diego Demographics And Statistics
Population over time in San Diego
The current population in San Diego is 1,385,061. The population has increased 8.0% from 2010.
| Year | Population | % Change |
|---|---|---|
| 2023 | 1,385,061 | 0.1% |
| 2022 | 1,383,987 | -0.1% |
| 2021 | 1,385,398 | -2.1% |
| 2020 | 1,414,545 | 0.4% |
| 2019 | 1,409,573 | 0.5% |
| 2018 | 1,401,932 | 0.8% |
| 2017 | 1,390,966 | 1.2% |
| 2016 | 1,374,812 | 1.1% |
| 2015 | 1,359,791 | 1.4% |
| 2014 | 1,341,510 | 1.4% |
| 2013 | 1,322,838 | 1.1% |
| 2012 | 1,308,619 | 0.9% |
| 2011 | 1,296,437 | 1.1% |
| 2010 | 1,282,800 | - |
Race / Ethnicity in San Diego
San Diego is:
41.4% White with 573,281 White residents.
5.4% African American with 74,890 African American residents.
0.2% American Indian with 2,365 American Indian residents.
17.2% Asian with 238,921 Asian residents.
0.4% Hawaiian with 5,862 Hawaiian residents.
0.6% Other with 8,113 Other residents.
5.2% Two Or More with 72,136 Two Or More residents.
29.6% Hispanic with 409,493 Hispanic residents.
| Race | San Diego | CA | USA |
|---|---|---|---|
| White | 41.4% | 34.6% | 58.2% |
| African American | 5.4% | 5.3% | 12.0% |
| American Indian | 0.2% | 0.3% | 0.5% |
| Asian | 17.2% | 15.1% | 5.7% |
| Hawaiian | 0.4% | 0.3% | 0.2% |
| Other | 0.6% | 0.5% | 0.5% |
| Two Or More | 5.2% | 4.1% | 3.9% |
| Hispanic | 29.6% | 39.8% | 19.0% |
Gender in San Diego
San Diego is 49.2% female with 681,970 female residents.
San Diego is 50.8% male with 703,091 male residents.
| Gender | San Diego | CA | USA |
|---|---|---|---|
| Female | 49.2% | 50.0% | 50.5% |
| Male | 50.8% | 50.0% | 49.5% |
Highest level of educational attainment in San Diego for adults over 25
4.0% of adults in San Diego completed < 9th grade.
5.0% of adults in San Diego completed 9-12th grade.
15.0% of adults in San Diego completed high school / ged.
18.0% of adults in San Diego completed some college.
7.0% of adults in San Diego completed associate's degree.
29.0% of adults in San Diego completed bachelor's degree.
14.0% of adults in San Diego completed master's degree.
4.0% of adults in San Diego completed professional degree.
4.0% of adults in San Diego completed doctorate degree.
| Education | San Diego | CA | USA |
|---|---|---|---|
| < 9th Grade | 4.0% | 8.0% | 5.0% |
| 9-12th Grade | 5.0% | 7.0% | 6.0% |
| High School / GED | 15.0% | 20.0% | 26.0% |
| Some College | 18.0% | 20.0% | 19.0% |
| Associate's Degree | 7.0% | 8.0% | 9.0% |
| Bachelor's Degree | 29.0% | 22.0% | 21.0% |
| Master's Degree | 14.0% | 10.0% | 10.0% |
| Professional Degree | 4.0% | 3.0% | 2.0% |
| Doctorate Degree | 4.0% | 2.0% | 2.0% |
Household Income For San Diego, California
4.3% of households in San Diego earn Less than $10,000.
2.4% of households in San Diego earn $10,000 to $14,999.
4.4% of households in San Diego earn $15,000 to $24,999.
4.8% of households in San Diego earn $25,000 to $34,999.
7.3% of households in San Diego earn $35,000 to $49,999.
12.5% of households in San Diego earn $50,000 to $74,999.
12.4% of households in San Diego earn $75,000 to $99,999.
19.4% of households in San Diego earn $100,000 to $149,999.
12.1% of households in San Diego earn $150,000 to $199,999.
20.4% of households in San Diego earn $200,000 or more.
| Income | San Diego | CA | USA |
|---|---|---|---|
| Less than $10,000 | 4.3% | 4.4% | 4.9% |
| $10,000 to $14,999 | 2.4% | 3.0% | 3.6% |
| $15,000 to $24,999 | 4.4% | 5.2% | 6.6% |
| $25,000 to $34,999 | 4.8% | 5.5% | 6.8% |
| $35,000 to $49,999 | 7.3% | 8.4% | 10.4% |
| $50,000 to $74,999 | 12.5% | 13.3% | 15.7% |
| $75,000 to $99,999 | 12.4% | 11.8% | 12.7% |
| $100,000 to $149,999 | 19.4% | 17.9% | 17.4% |
| $150,000 to $199,999 | 12.1% | 11.1% | 9.3% |
| $200,000 or more | 20.4% | 19.4% | 12.6% |


