Racial diversity in California is a mixed bag.
There are parts of California where there’s a high level of diversity. But where will you find the most diverse places in California?
To answer that question, we went to the US Census data. Using Saturday Night Science, we measured the Gini coefficient for all 428 cities in California to rank them from most to least diverse.
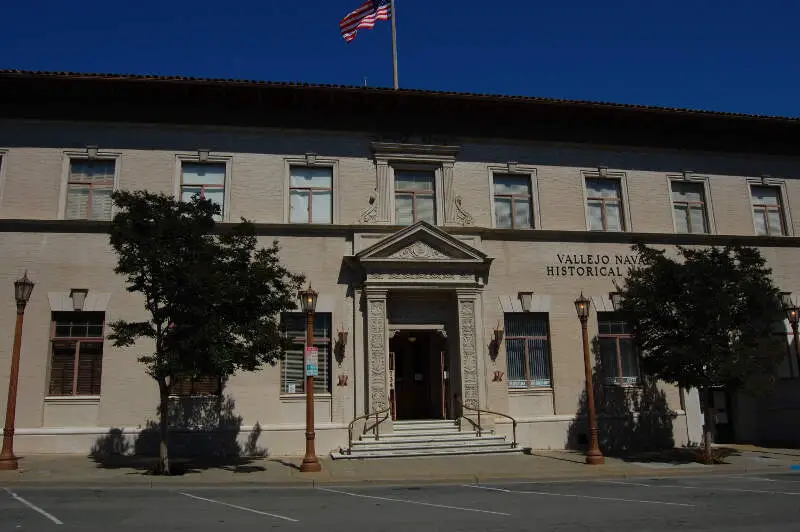
#1 most diverse in California
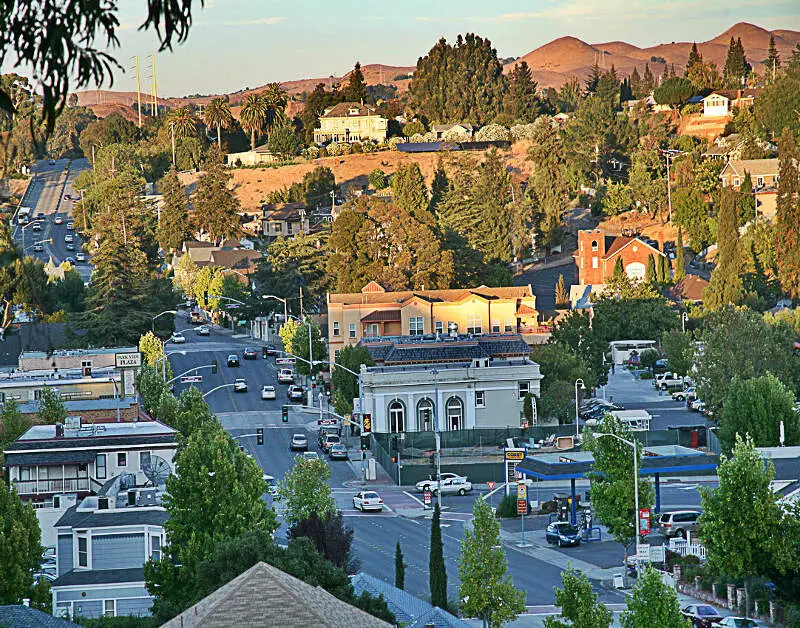
Vallejo oh; Spanish: ) is a waterfront city in Solano County, California, located in the North Bay region of the San Francisco Bay Area. Vallejo is geographically the closest North Bay city to the inner East Bay, so it is sometimes mistakenly associated with that region. The population was 115,942 at the 2010 census. It is the tenth most populous city in the San Francisco Bay Area, and the largest in Solano County. Vallejo sits on the northeastern shore of San Pablo Bay, 30 miles north of San Francisco, the northwestern shore of the Carquinez Strait and the southern end of the Napa River, 15 miles south of Napa. The city is named after General Mariano Guadalupe Vallejo, a native Californio, leading proponent of California’s statehood, and one of the first members of the California State Senate; the neighboring city of Benicia is named for his wife, Francisca Benicia Carrillo de Vallejo.
Data | Crime | Cost of living | Movers
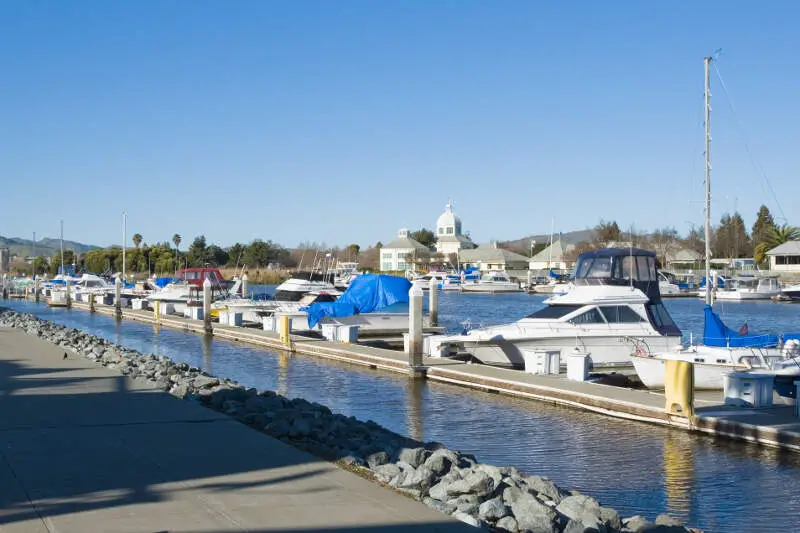
#2 most diverse in California
Suisun City is a city in Solano County, California, United States. The population was 28,111 at the 2010 census. The city takes its name from the adjacent Suisun Bay, which in turn is named for the Suisunes, an indigenous tribe of the area.
Data | Crime | Cost of living | Movers
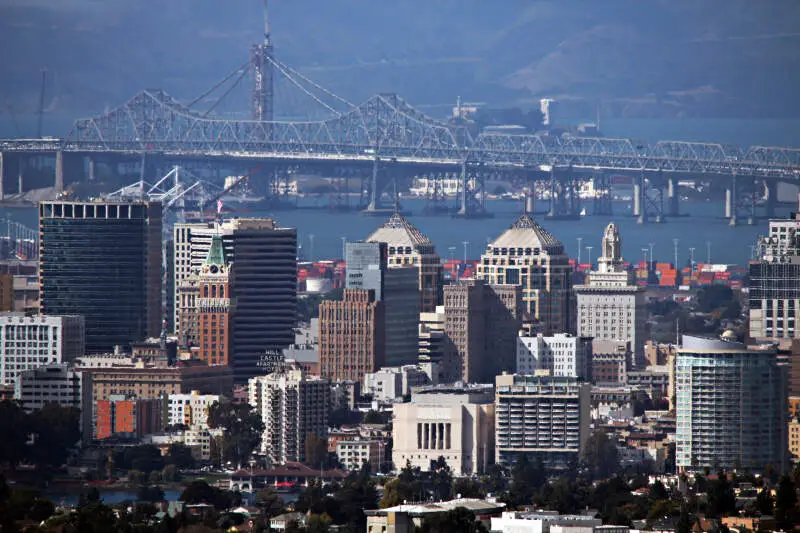
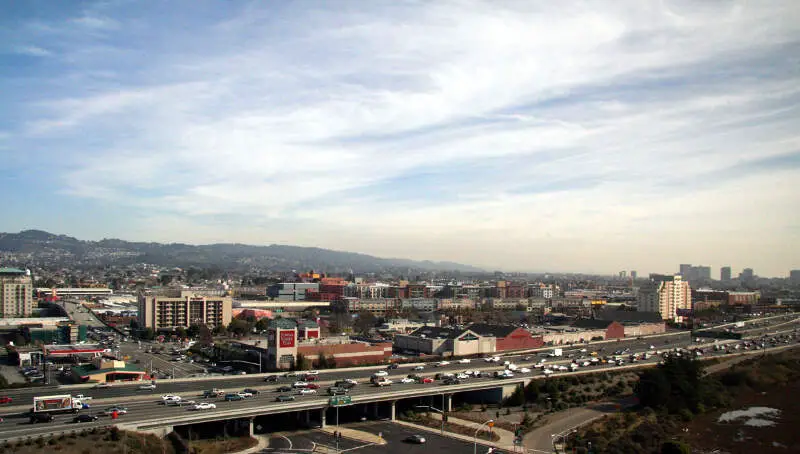
#3 most diverse in California
Oakland is the largest city and the county seat of Alameda County, California, United States. A major West Coast port city, Oakland is the largest city in the East Bay region of the San Francisco Bay Area, the third largest city overall in the San Francisco Bay Area, the eighth most populated city in California, and the 45th largest city in the United States. With a population of 419,267 as of 2015, it serves as a trade center for the San Francisco Bay Area; its Port of Oakland is the busiest port in the San Francisco Bay, the entirety of Northern California, and the fifth busiest in the United States of America. The city was incorporated in 1852.
Data | Crime | Cost of living | Movers | Compare
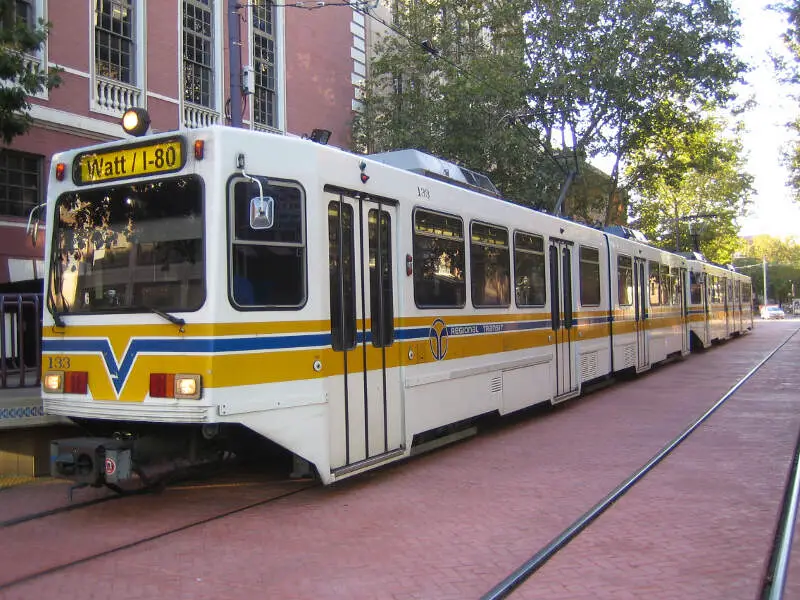
#4 most diverse in California
Sacramento is the capital city of the U.S. state of California and the seat of Sacramento County. It is at the confluence of the Sacramento River and the American River in the northern portion of California’s expansive Central Valley, known as the Sacramento Valley. Its estimated 2016 population of 493,025 makes it the sixth-largest city in California, the fastest-growing big city in the state, and the 35th largest city in the United States. Sacramento is the cultural and economic core of the Sacramento metropolitan area, which includes seven counties with a 2010 population of 2,414,783. Its metropolitan area is the fourth largest in California after the Greater Los Angeles area, the San Francisco Bay Area, and the San Diego metropolitan area, and is the 27th largest in the United States. In 2002, the Civil Rights Project at Harvard University conducted for Time magazine named Sacramento “America’s Most Diverse City”.
Data | Crime | Cost of living | Movers | Compare
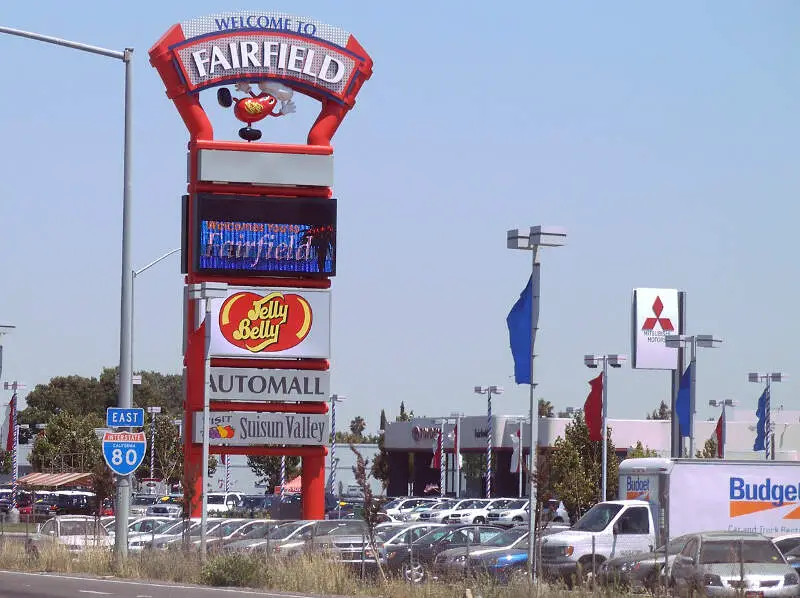
#5 most diverse in California
Fairfield is a city in, and the county seat of, Solano County, California, in the North Bay sub-region of the San Francisco Bay Area. It is generally considered the midpoint between the cities of San Francisco and Sacramento, approximately 40 miles from the city center of both cities, approximately 40 miles from the city center of Oakland, less than 19 miles from Napa Valley, 16 miles from the Carquinez Bridge, and 14 miles from the Benicia Bridge. Fairfield was founded in 1856 by clippership captain Robert H. Waterman, and named after his former hometown of Fairfield, Connecticut.
Data | Crime | Cost of living | Movers
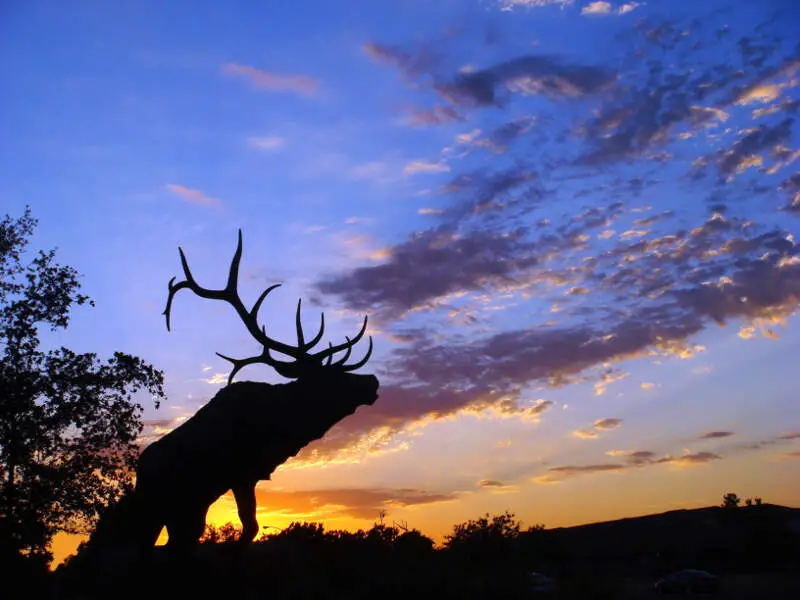
#6 most diverse in California
Elk Grove is a city in Sacramento County, California, located just south of the state capital of Sacramento. It is part of the Sacramento-Arden-Arcade-Roseville Metropolitan Statistical Area. As of 2015, the population of the city was estimated at 167,965. The second-largest city in Sacramento County, Elk Grove was the fastest growing city in the U.S. between July 1, 2004, and July 1, 2005.
Data | Crime | Cost of living | Movers
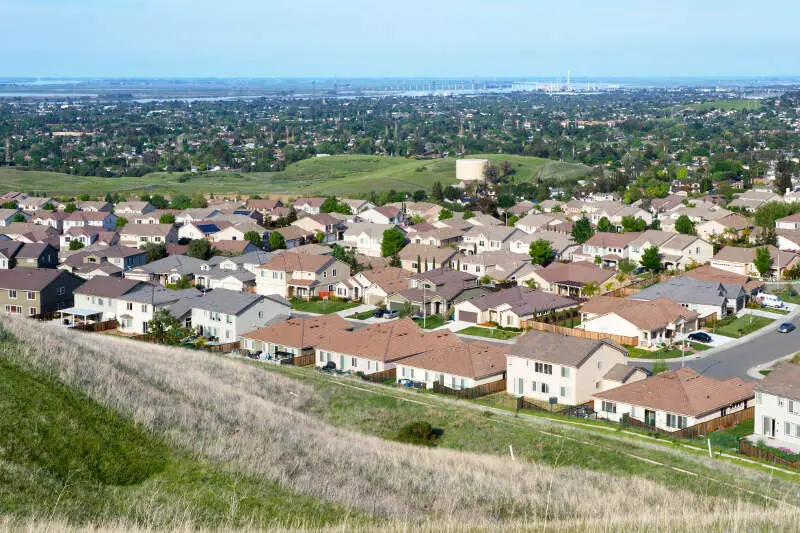
#7 most diverse in California
Antioch is a city in Contra Costa County, California, United States. Located in the East Bay region of the San Francisco Bay Area along the San Joaquin-Sacramento River Delta, it is a suburb of San Francisco and Oakland. The city’s population was 102,372 at the 2010 census and estimated to be 110,542 in 2015.
Data | Crime | Cost of living | Movers
#8 most diverse in California
Emeryville is a small city located in northwest Alameda County, California, in the United States. It is located in a corridor between the cities of Berkeley and Oakland, extending to the shore of San Francisco Bay. Its proximity to San Francisco, the Bay Bridge, the University of California, Berkeley, and Silicon Valley has been a catalyst for recent economic growth.
Data | Crime | Cost of living | Movers
#9 most diverse in California
Pinole is a city in Contra Costa County, California, United States. The population was 18,390 at the 2010 census.
Data | Crime | Cost of living | Movers
#10 most diverse in California
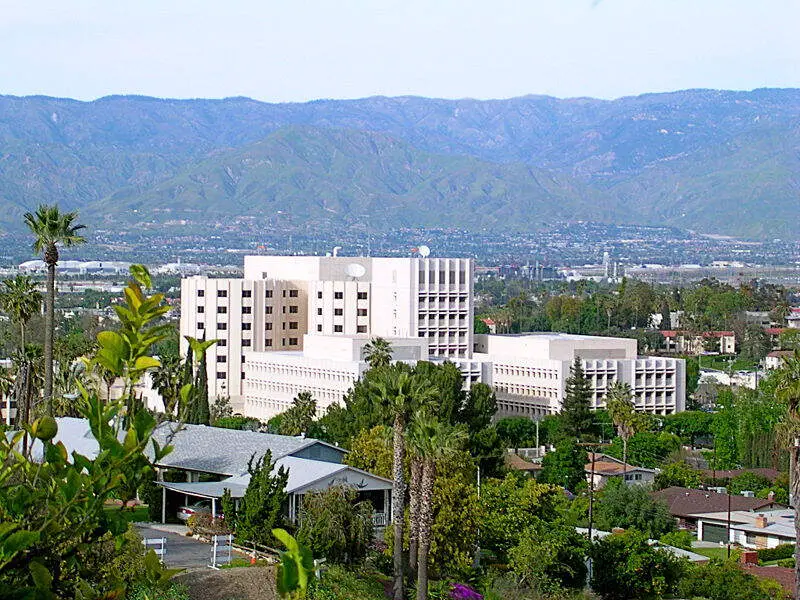
Loma Linda is a city in San Bernardino County, California, United States, that was incorporated in 1970. The population was 23,261 at the 2010 census, up from 18,681 at the 2000 census. The central area of the city was originally known as Mound City; its eastern half was originally the unincorporated community of Bryn Mawr.
Data | Crime | Cost of living | Movers
The receipts
Compare the top ten
Pick a metric. The bars rescale. The red line is California’s statewide median.
On the map
Where diversity lives in California
Saturday Night Science
Methodology: How we determined the most diverse cities in California for 2026
We still believe in the accuracy of data — especially from the Census — and Saturday Night Science. So that’s where we went to get the race breakdown across California.
That leads us to the Census’s most recently available data, the 2020-2024 American Community Survey data from the US Census.
Specifically, we looked at table B03002: HISPANIC OR LATINO ORIGIN BY RACE. Here are the category names as defined by the Census:
- White alone*
- Black or African American alone*
- American Indian and Alaska Native alone*
- Asian alone*
- Native Hawaiian and Other Pacific Islander alone*
- Some other race alone*
- Two or more races*
- Hispanic or Latino
We limited our analysis to non-CDPs with a population greater than 5,000 people. That left us with 428 cities.
We then calculated the HHI for each city by finding the racial breakdown of a city in percent terms, squaring them, and then adding the squares together. This left us with scores ranging from 2,167 (Vallejo) to 9,863 (Huron).
Finally, we ranked each city based on the HHI, with a lower score being more diverse than a high score. Vallejo took the distinction of being the most diverse, while Huron was the least diverse city.
We updated this article for 2026. This report is our eleventh time ranking the most diverse places in California.
The full plate
Race By City In California For 2026
Click any column to sort. Search by city name.
| Rank | City | Population | HHI | % White | % Black | % Hispanic | % Asian |
|---|---|---|---|---|---|---|---|
| 1 | Vallejo | 124,268 | 2,167 | 20.5% | 16.9% | 29.8% | 22.7% |
| 2 | Suisun City | 29,286 | 2,180 | 21.7% | 19.0% | 30.7% | 18.6% |
| 3 | Oakland | 439,418 | 2,274 | 27.8% | 19.7% | 28.7% | 15.7% |
| 4 | Sacramento | 528,706 | 2,316 | 29.3% | 11.8% | 29.4% | 20.1% |
| 5 | Fairfield | 120,785 | 2,339 | 26.4% | 14.2% | 32.7% | 17.9% |
| 6 | Elk Grove | 179,155 | 2,382 | 30.4% | 10.4% | 17.9% | 31.0% |
| 7 | Antioch | 116,477 | 2,387 | 23.4% | 18.2% | 35.6% | 13.9% |
| 8 | Emeryville | 13,081 | 2,469 | 31.0% | 19.2% | 11.6% | 31.4% |
| 9 | Pinole | 18,761 | 2,527 | 29.2% | 9.0% | 28.7% | 27.2% |
| 10 | Loma Linda | 25,122 | 2,578 | 28.5% | 7.8% | 29.8% | 28.3% |
| 11 | American Canyon | 21,691 | 2,614 | 20.5% | 4.8% | 32.1% | 32.9% |
| 12 | Marina | 22,563 | 2,632 | 37.9% | 7.7% | 30.1% | 12.7% |
| 13 | San Leandro | 87,826 | 2,638 | 19.7% | 9.5% | 29.3% | 35.8% |
| 14 | San Bruno | 42,307 | 2,693 | 28.6% | 2.1% | 29.2% | 31.4% |
| 15 | Pittsburg | 76,257 | 2,699 | 15.8% | 13.7% | 43.0% | 19.5% |
| 16 | Signal Hill | 11,468 | 2,713 | 27.0% | 6.3% | 37.4% | 22.6% |
| 17 | Lathrop | 35,052 | 2,725 | 15.8% | 6.9% | 35.4% | 33.6% |
| 18 | Hercules | 26,302 | 2,745 | 14.4% | 18.3% | 14.5% | 44.1% |
| 19 | Lomita | 20,225 | 2,749 | 34.2% | 4.3% | 34.4% | 17.2% |
| 20 | Pasadena | 136,969 | 2,751 | 34.9% | 8.0% | 34.0% | 17.0% |
| 21 | San Mateo | 103,105 | 2,767 | 34.4% | 1.4% | 27.6% | 28.0% |
| 22 | Carson | 92,871 | 2,779 | 6.3% | 21.7% | 39.1% | 26.8% |
| 23 | Tracy | 96,966 | 2,792 | 23.6% | 6.4% | 40.4% | 23.2% |
| 24 | Alameda | 77,238 | 2,799 | 40.9% | 6.0% | 13.9% | 28.6% |
| 25 | Lakewood | 79,850 | 2,804 | 30.4% | 7.0% | 38.9% | 17.0% |
| 26 | La Habra Heights | 5,478 | 2,845 | 44.4% | 1.4% | 19.4% | 20.1% |
| 27 | Brentwood | 65,208 | 2,850 | 42.2% | 7.7% | 27.1% | 15.3% |
| 28 | Hayward | 158,801 | 2,854 | 12.7% | 7.6% | 41.3% | 30.0% |
| 29 | Torrance | 142,130 | 2,864 | 32.7% | 3.6% | 19.3% | 37.0% |
| 30 | Richmond | 115,505 | 2,867 | 18.1% | 16.1% | 45.5% | 13.6% |
| 31 | Rancho Cucamonga | 175,411 | 2,875 | 33.4% | 8.3% | 38.1% | 15.0% |
| 32 | South Pasadena | 26,068 | 2,897 | 35.2% | 2.8% | 19.7% | 35.0% |
| 33 | San Francisco | 830,235 | 2,898 | 36.8% | 4.7% | 16.2% | 34.9% |
| 34 | Culver City | 39,931 | 2,907 | 44.8% | 6.6% | 20.0% | 19.8% |
| 35 | San Diego | 1,389,526 | 2,917 | 40.9% | 5.3% | 29.8% | 17.3% |
| 35 | Long Beach | 455,548 | 2,918 | 26.2% | 11.4% | 43.8% | 12.7% |
| 37 | Stockton | 322,326 | 2,936 | 16.8% | 10.8% | 45.6% | 20.8% |
| 38 | Yuba City | 69,471 | 2,936 | 37.2% | 1.9% | 33.3% | 20.2% |
| 39 | Brea | 47,469 | 2,942 | 35.4% | 1.6% | 29.9% | 27.7% |
| 40 | Cypress | 49,498 | 2,944 | 31.5% | 2.9% | 21.5% | 38.1% |
| 41 | Rancho Cordova | 81,849 | 2,945 | 46.0% | 10.0% | 22.0% | 14.7% |
| 42 | West Sacramento | 54,927 | 2,951 | 40.0% | 4.6% | 33.2% | 13.0% |
| 43 | California City | 14,414 | 2,953 | 28.2% | 23.5% | 39.6% | 2.0% |
| 44 | Redwood City | 82,447 | 2,975 | 36.7% | 2.9% | 35.6% | 18.0% |
| 45 | Vacaville | 102,596 | 2,982 | 44.3% | 8.3% | 27.9% | 11.0% |
| 46 | Chino Hills | 77,927 | 2,999 | 23.8% | 4.4% | 27.3% | 40.7% |
| 47 | Gardena | 59,422 | 3,002 | 7.4% | 17.2% | 44.4% | 25.6% |
| 48 | San Jose | 990,138 | 3,005 | 22.3% | 2.7% | 30.8% | 39.2% |
| 49 | Eastvale | 70,633 | 3,012 | 16.8% | 7.4% | 41.5% | 30.8% |
| 50 | Morgan Hill | 45,425 | 3,017 | 37.3% | 2.8% | 35.9% | 17.1% |
| 51 | Live Oak | 9,347 | 3,028 | 28.9% | 1.9% | 41.7% | 20.7% |
| 52 | Concord | 124,035 | 3,036 | 41.6% | 3.7% | 32.4% | 13.7% |
| 53 | El Cerrito | 25,994 | 3,040 | 44.1% | 5.2% | 14.8% | 28.3% |
| 54 | Claremont | 36,595 | 3,041 | 44.0% | 6.9% | 28.8% | 14.4% |
| 55 | Tustin | 78,981 | 3,056 | 25.5% | 2.5% | 41.2% | 26.2% |
| 56 | Lemon Grove | 27,686 | 3,057 | 26.9% | 12.0% | 45.4% | 10.0% |
| 56 | Albany | 19,414 | 3,058 | 43.0% | 3.4% | 12.2% | 31.2% |
| 58 | Mountain View | 83,732 | 3,063 | 37.4% | 2.4% | 17.5% | 36.3% |
| 59 | Oakley | 45,183 | 3,068 | 40.7% | 8.8% | 34.7% | 9.9% |
| 60 | Fountain Valley | 56,258 | 3,088 | 37.6% | 1.6% | 17.2% | 36.7% |
| 61 | Los Alamitos | 11,794 | 3,094 | 42.2% | 2.4% | 31.3% | 17.1% |
| 62 | Lake Forest | 86,281 | 3,096 | 44.1% | 2.4% | 27.0% | 19.7% |
| 63 | Fullerton | 140,968 | 3,106 | 29.4% | 1.8% | 40.3% | 24.6% |
| 64 | Campbell | 42,781 | 3,108 | 44.9% | 1.5% | 19.5% | 25.8% |
| 65 | San Dimas | 33,789 | 3,113 | 33.7% | 3.4% | 40.9% | 16.3% |
| 66 | Monrovia | 37,571 | 3,130 | 28.1% | 5.5% | 45.2% | 15.6% |
| 67 | Manteca | 89,043 | 3,131 | 34.0% | 4.0% | 41.2% | 15.6% |
| 68 | Placentia | 52,826 | 3,132 | 36.6% | 2.1% | 37.9% | 18.4% |
| 69 | Pacifica | 37,261 | 3,138 | 47.0% | 1.2% | 19.6% | 21.7% |
| 70 | Twentynine Palms | 27,355 | 3,158 | 46.5% | 9.3% | 27.6% | 3.9% |
| 71 | Artesia | 15,889 | 3,177 | 13.1% | 5.2% | 33.1% | 43.2% |
| 72 | Newark | 46,903 | 3,190 | 16.7% | 3.2% | 27.2% | 46.3% |
| 73 | Berkeley | 120,257 | 3,191 | 49.9% | 7.7% | 12.8% | 20.4% |
| 73 | South San Francisco | 64,305 | 3,191 | 20.0% | 1.5% | 32.1% | 41.8% |
| 75 | Santa Clarita | 230,221 | 3,209 | 41.2% | 4.3% | 36.3% | 12.0% |
| 76 | Buena Park | 82,871 | 3,218 | 20.0% | 1.7% | 42.1% | 32.1% |
| 77 | Upland | 79,257 | 3,226 | 34.2% | 5.9% | 43.4% | 11.1% |
| 78 | Los Angeles | 3,857,263 | 3,237 | 28.1% | 8.1% | 47.2% | 11.9% |
| 79 | Barstow | 25,100 | 3,247 | 22.2% | 16.4% | 49.1% | 2.9% |
| 80 | La Mirada | 47,180 | 3,255 | 25.8% | 3.1% | 46.0% | 21.2% |
| 81 | Belmont | 27,337 | 3,262 | 45.8% | 1.8% | 13.1% | 30.6% |
| 82 | Lancaster | 169,169 | 3,273 | 23.5% | 19.1% | 48.2% | 4.1% |
| 83 | Murrieta | 112,064 | 3,292 | 46.6% | 5.2% | 31.4% | 8.4% |
| 84 | Redlands | 73,375 | 3,337 | 40.6% | 5.6% | 39.5% | 8.2% |
| 85 | Seaside | 31,814 | 3,340 | 29.4% | 4.7% | 48.2% | 9.4% |
| 86 | Irvine | 311,690 | 3,342 | 34.3% | 1.9% | 11.4% | 44.6% |
| 87 | Oceanside | 172,242 | 3,343 | 42.6% | 4.2% | 37.5% | 8.2% |
| 87 | Menifee | 110,305 | 3,344 | 39.1% | 7.2% | 41.2% | 6.1% |
| 89 | Duarte | 22,184 | 3,345 | 23.5% | 4.0% | 49.4% | 17.9% |
| 90 | La Verne | 30,600 | 3,350 | 43.3% | 3.1% | 36.3% | 10.8% |
| 91 | Sierra Madre | 10,940 | 3,351 | 51.6% | 6.6% | 17.9% | 17.1% |
| 92 | Orange | 138,266 | 3,352 | 39.2% | 1.5% | 39.9% | 13.8% |
| 93 | Glendora | 50,926 | 3,356 | 40.1% | 2.8% | 39.7% | 11.9% |
| 94 | Temecula | 111,167 | 3,356 | 48.4% | 4.7% | 29.0% | 10.3% |
| 95 | Davis | 66,978 | 3,361 | 49.9% | 2.2% | 15.1% | 24.2% |
| 96 | Clovis | 124,725 | 3,372 | 45.0% | 1.8% | 33.8% | 13.3% |
| 97 | Rancho Palos Verdes | 40,864 | 3,389 | 46.7% | 1.6% | 12.1% | 31.8% |
| 98 | Millbrae | 22,689 | 3,401 | 29.4% | 0.8% | 13.9% | 48.1% |
| 99 | Pleasanton | 76,960 | 3,408 | 36.1% | 1.6% | 12.5% | 43.7% |
| 100 | Corona | 159,670 | 3,409 | 30.4% | 4.9% | 48.1% | 11.6% |
Source: U.S. Census ACS 2020-2024. 428 cities with more than 5,000 residents.
Summary
Summary: Diversity Across California
If you’re looking for a scientific breakdown of diversity across California, this is an accurate list.
The most diverse cities in California are Vallejo, Suisun City, Oakland, Sacramento, Fairfield, Elk Grove, Antioch, Emeryville, Pinole, and Loma Linda. Not sold on California? Take the two-minute Find Your Place quiz and see which state actually fits you.
Questions and answers
Most Diverse Cities In California FAQs
What is the most diverse city in California?
Vallejo is the most diverse city in California for 2026, posting the lowest diversity index (2,167) of the 428 places we measured. Suisun City and Oakland are next.
What are the 10 most diverse cities in California?
The ten most diverse cities in California are Vallejo, Suisun City, Oakland, Sacramento, Fairfield, Elk Grove, Antioch, Emeryville, Pinole, and Loma Linda. We ranked all 428 places with more than 5,000 residents by their racial-diversity HHI.
How do you measure diversity?
We use a Herfindahl-Hirschman Index (HHI) across each city’s White, Black, Hispanic, and Asian population shares from the Census American Community Survey. A lower score means the mix is more even, so the lowest HHI wins.
What is the least diverse city in California?
Huron is the least diverse city in California, with a diversity index of 9,863. That means one group makes up most of its population.
Where does this data come from?
All population shares come from the Census Bureau’s American Community Survey (2020-2024). Diversity scores in California range from 2,167 in Vallejo to 9,863 in Huron.


