Milford SnackAbility
Overall SnackAbility
Crime in Milford summary. We use data from the FBI to determine the crime rates in Milford. Key points include:
There were 623 total crimes in Milford in the last reporting year.
The overall crime rate per 100,000 people in Milford is 4,441.1 / 100k people.
The violent crime rate per 100,000 people in Milford is 791.3 / 100k people.
The property crime rate per 100,000 people in Milford is 3,649.8 / 100k people.
Overall, crime in Milford is 109.56% above the national average.
Total Crimes
Above National Average
Crime In Milford Comparison Table
| Statistic | Count Raw |
Milford / 100k People |
Delaware / 100k People |
National / 100k People |
|---|---|---|---|---|
| Total Crimes Per 100K | 623 | 4,441.1 | 2,106.5 | 2,119.2 |
| Violent Crime | 111 | 791.3 | 360.8 | 359.0 |
| Murder | 3 | 21.4 | 5.7 | 5.0 |
| Robbery | 7 | 49.9 | 47.0 | 61.0 |
| Aggravated Assault | 96 | 684.3 | 292.4 | 256.0 |
| Property Crime | 512 | 3,649.8 | 1,745.8 | 1,760.0 |
| Burglary | 44 | 313.7 | 175.1 | 229.0 |
| Larceny | 425 | 3,029.7 | 1,361.9 | 1,272.0 |
| Car Theft | 43 | 306.5 | 208.8 | 259.0 |
Source: FBI Uniform Crime Reporting (2024)
Cost of living in Milford summary. We use data on the cost of living to determine how expensive it is to live in Milford. Real estate prices drive most of the variance in cost of living around Delaware. Key points include:
The cost of living in Milford is 103 with 100 being average.
The cost of living in Milford is 1.0x higher than the national average.
The median home value in Milford is $343,315.
The median income in Milford is $59,464.
Milford's Overall Cost Of Living
Higher Than The National Average
Cost Of Living In Milford Comparison Table
| Living Expense | Milford | Delaware | National Average |
|---|---|---|---|
| Overall | 103 | 105 | 100 |
| Services | 99 | 99 | 100 |
| Groceries | 102 | 102 | 100 |
| Health | 111 | 121 | 100 |
| Housing | 100 | 99 | 100 |
| Transportation | 102 | 102 | 100 |
| Utilities | 102 | 103 | 100 |
Source: Cost of living index, normalized to US average = 100
Milford, DE Weather
The average high in Milford is 66.3° and the average low is 46.6°.
There are 75.2 days of precipitation each year.
Expect an average of 45.2 inches of precipitation each year with 12.4 inches of snow.
| Stat | Milford |
|---|---|
| Average Annual High | 66.3 |
| Average Annual Low | 46.6 |
| Annual Precipitation Days | 75.2 |
| Average Annual Precipitation | 45.2 |
| Average Annual Snowfall | 12.4 |
Average High
Days of Rain
Source: NOAA climate normals (30-year)
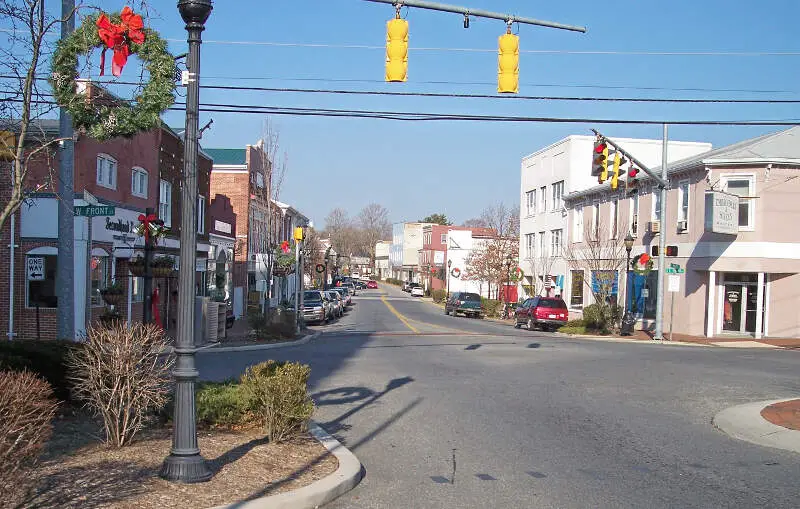
Milford, DE Photos


1 Reviews & Comments About Milford

Lovely small town experience, nice people. Great downtown area. Great Coffee shop called DOLCE. Great theater, Riverfront Theatre. Wonderful antique shop Maggie and Friend.
The Riverwalk
Dolce
Riverfront Theatre
Milford Art League
Maggie and Friends Antique Shop
Delaware Music School
The Irish Shop
Arena's
Furbaby
Tattoos and Kayaak rentals
Rankings & Articles For Milford


Locations Around Milford
Map Of Milford, DE
Best Places Around Milford
Georgetown, GA
Population 11,158
Highland Acres, DE
Population 3,752
Lewes, DE
Population 3,505
Milton, DE
Population 3,567
Camden, DE
Population 4,106
Milford Demographics And Statistics
Population over time in Milford
The current population in Milford is 12,803. The population has increased 39.5% from 2010.
| Year | Population | % Change |
|---|---|---|
| 2024 | 12,803 | 5.0% |
| 2023 | 12,193 | 4.1% |
| 2022 | 11,714 | 4.1% |
| 2021 | 11,249 | -1.9% |
| 2020 | 11,463 | 3.2% |
| 2019 | 11,111 | 2.5% |
| 2018 | 10,835 | 1.8% |
| 2017 | 10,645 | 1.1% |
| 2016 | 10,532 | 5.4% |
| 2015 | 9,993 | 1.1% |
| 2014 | 9,882 | 1.5% |
| 2013 | 9,735 | 2.3% |
| 2012 | 9,513 | 1.5% |
| 2011 | 9,372 | 2.1% |
| 2010 | 9,180 | - |
Race / Ethnicity in Milford
See the full breakdown
Milford is:
53.7% White with 6,876 White residents.
19.5% African American with 2,497 African American residents.
0.1% American Indian with 17 American Indian residents.
4.6% Asian with 585 Asian residents.
0.0% Hawaiian with 0 Hawaiian residents.
0.1% Other with 16 Other residents.
5.5% Two Or More with 704 Two Or More residents.
16.5% Hispanic with 2,108 Hispanic residents.
| Race | Milford | DE | USA |
|---|---|---|---|
| White | 53.7% | 58.1% | 57.4% |
| African American | 19.5% | 21.4% | 11.9% |
| American Indian | 0.1% | 0.1% | 0.5% |
| Asian | 4.6% | 4.3% | 5.9% |
| Hawaiian | 0.0% | 0.0% | 0.2% |
| Other | 0.1% | 0.5% | 0.6% |
| Two Or More | 5.5% | 4.5% | 4.3% |
| Hispanic | 16.5% | 11.0% | 19.3% |
Gender in Milford
See the full breakdown
Milford is 56.5% female with 7,234 female residents.
Milford is 43.5% male with 5,568 male residents.
| Gender | Milford | DE | USA |
|---|---|---|---|
| Female | 56.5% | 51.6% | 50.5% |
| Male | 43.5% | 48.4% | 49.5% |
Highest level of educational attainment in Milford for adults over 25
See the full breakdown
5.0% of adults in Milford completed < 9th grade.
5.0% of adults in Milford completed 9-12th grade.
35.0% of adults in Milford completed high school / ged.
18.0% of adults in Milford completed some college.
9.0% of adults in Milford completed associate's degree.
18.0% of adults in Milford completed bachelor's degree.
7.0% of adults in Milford completed master's degree.
1.0% of adults in Milford completed professional degree.
2.0% of adults in Milford completed doctorate degree.
| Education | Milford | DE | USA |
|---|---|---|---|
| < 9th Grade | 5.0% | 4.0% | 4.0% |
| 9-12th Grade | 5.0% | 5.0% | 6.0% |
| High School / GED | 35.0% | 29.0% | 26.0% |
| Some College | 18.0% | 19.0% | 19.0% |
| Associate's Degree | 9.0% | 8.0% | 9.0% |
| Bachelor's Degree | 18.0% | 20.0% | 22.0% |
| Master's Degree | 7.0% | 11.0% | 10.0% |
| Professional Degree | 1.0% | 2.0% | 2.0% |
| Doctorate Degree | 2.0% | 2.0% | 2.0% |
Household Income For Milford, Delaware
See the full breakdown
2.4% of households in Milford earn Less than $10,000.
5.5% of households in Milford earn $10,000 to $14,999.
9.1% of households in Milford earn $15,000 to $24,999.
10.7% of households in Milford earn $25,000 to $34,999.
13.1% of households in Milford earn $35,000 to $49,999.
19.5% of households in Milford earn $50,000 to $74,999.
14.2% of households in Milford earn $75,000 to $99,999.
18.0% of households in Milford earn $100,000 to $149,999.
4.1% of households in Milford earn $150,000 to $199,999.
3.4% of households in Milford earn $200,000 or more.
| Income | Milford | DE | USA |
|---|---|---|---|
| Less than $10,000 | 2.4% | 4.2% | 5.0% |
| $10,000 to $14,999 | 5.5% | 2.6% | 3.4% |
| $15,000 to $24,999 | 9.1% | 5.1% | 6.3% |
| $25,000 to $34,999 | 10.7% | 5.9% | 6.6% |
| $35,000 to $49,999 | 13.1% | 10.5% | 10.1% |
| $50,000 to $74,999 | 19.5% | 15.9% | 15.5% |
| $75,000 to $99,999 | 14.2% | 13.5% | 12.6% |
| $100,000 to $149,999 | 18.0% | 19.0% | 17.5% |
| $150,000 to $199,999 | 4.1% | 10.9% | 9.6% |
| $200,000 or more | 3.4% | 12.4% | 13.4% |
Source: U.S. Census ACS 5-year estimates (2024)


