Compare Boise City to…
Boise City SnackAbility
Overall SnackAbility
Boise City, ID Weather
The average high in Boise City is 63.7° and the average low is 38.4°.
There are 38.9 days of precipitation each year.
Expect an average of 11.9 inches of precipitation each year with 30.6 inches of snow.
| Stat | Boise City |
|---|---|
| Average Annual High | 63.7 |
| Average Annual Low | 38.4 |
| Annual Precipitation Days | 38.9 |
| Average Annual Precipitation | 11.9 |
| Average Annual Snowfall | 30.6 |
Average High
Days of Rain
Source: NOAA climate normals (30-year)
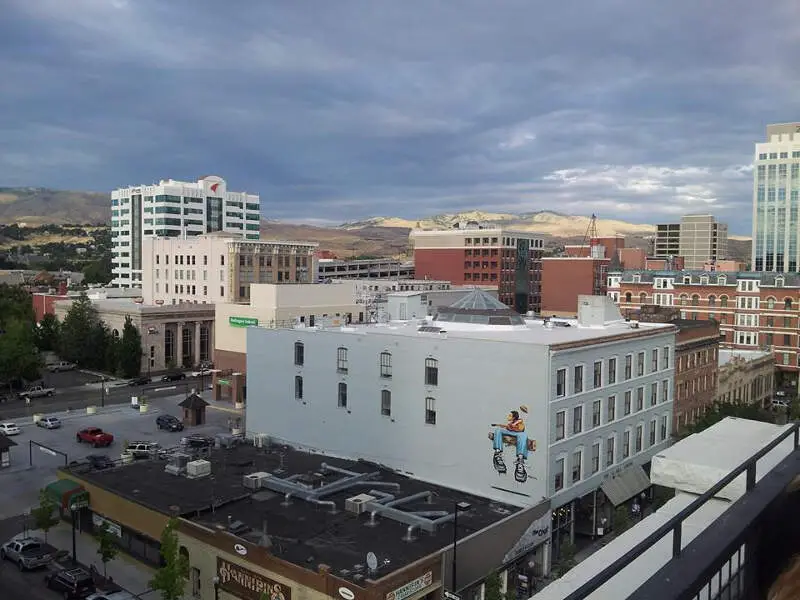
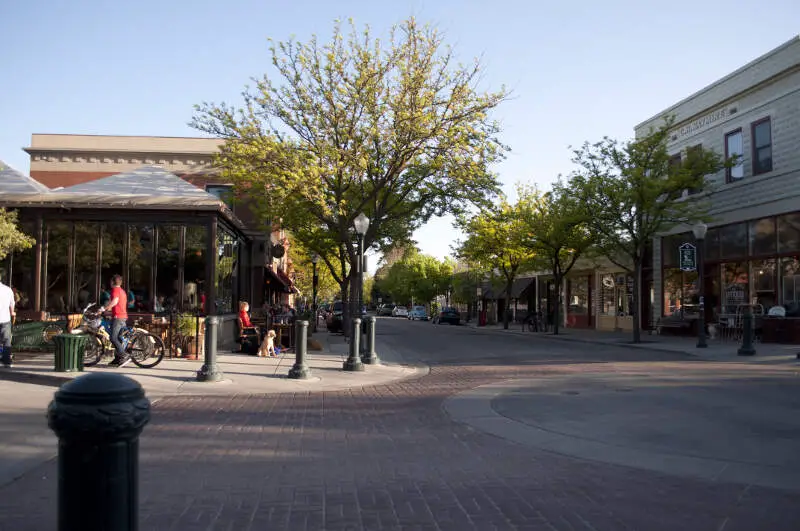
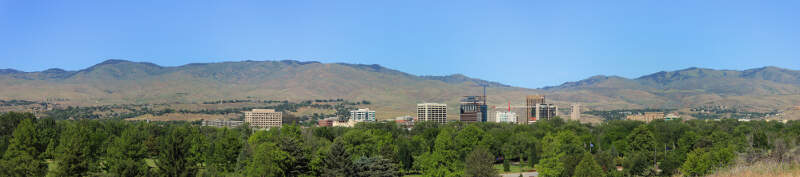
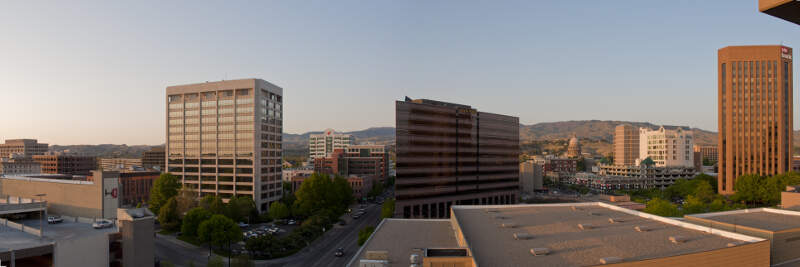
Boise City, ID Photos


Rankings & Articles For Boise City


Locations Around Boise City
Map Of Boise City, ID
Best Places Around Boise City
Boise City Demographics And Statistics
Population over time in Boise City
The current population in Boise City is 237,242. The population has increased 14.9% from 2010.
| Year | Population | % Change |
|---|---|---|
| 2024 | 237,242 | 0.7% |
| 2023 | 235,701 | 0.6% |
| 2022 | 234,192 | 1.1% |
| 2021 | 231,537 | 1.5% |
| 2020 | 228,057 | 0.9% |
| 2019 | 226,115 | 0.8% |
| 2018 | 224,300 | 1.6% |
| 2017 | 220,859 | 1.0% |
| 2016 | 218,677 | 2.1% |
| 2015 | 214,196 | 1.2% |
| 2014 | 211,655 | 0.9% |
| 2013 | 209,726 | 0.7% |
| 2012 | 208,332 | 0.4% |
| 2011 | 207,560 | 0.5% |
| 2010 | 206,481 | - |
Race / Ethnicity in Boise City
See the full breakdown
Boise City is:
79.5% White with 188,701 White residents.
1.6% African American with 3,805 African American residents.
0.3% American Indian with 655 American Indian residents.
3.7% Asian with 8,665 Asian residents.
0.3% Hawaiian with 624 Hawaiian residents.
0.4% Other with 1,055 Other residents.
4.7% Two Or More with 11,066 Two Or More residents.
9.6% Hispanic with 22,671 Hispanic residents.
| Race | Boise City | ID | USA |
|---|---|---|---|
| White | 79.5% | 78.6% | 57.4% |
| African American | 1.6% | 0.7% | 11.9% |
| American Indian | 0.3% | 0.7% | 0.5% |
| Asian | 3.7% | 1.3% | 5.9% |
| Hawaiian | 0.3% | 0.1% | 0.2% |
| Other | 0.4% | 0.6% | 0.6% |
| Two Or More | 4.7% | 4.2% | 4.3% |
| Hispanic | 9.6% | 13.6% | 19.3% |
Gender in Boise City
See the full breakdown
Boise City is 50.1% female with 118,789 female residents.
Boise City is 49.9% male with 118,453 male residents.
| Gender | Boise City | ID | USA |
|---|---|---|---|
| Female | 50.1% | 49.7% | 50.5% |
| Male | 49.9% | 50.3% | 49.5% |
Highest level of educational attainment in Boise City for adults over 25
See the full breakdown
3.0% of adults in Boise City completed < 9th grade.
3.0% of adults in Boise City completed 9-12th grade.
19.0% of adults in Boise City completed high school / ged.
21.0% of adults in Boise City completed some college.
7.0% of adults in Boise City completed associate's degree.
30.0% of adults in Boise City completed bachelor's degree.
12.0% of adults in Boise City completed master's degree.
3.0% of adults in Boise City completed professional degree.
2.0% of adults in Boise City completed doctorate degree.
| Education | Boise City | ID | USA |
|---|---|---|---|
| < 9th Grade | 3.0% | 4.0% | 4.0% |
| 9-12th Grade | 3.0% | 5.0% | 6.0% |
| High School / GED | 19.0% | 26.0% | 26.0% |
| Some College | 21.0% | 24.0% | 19.0% |
| Associate's Degree | 7.0% | 10.0% | 9.0% |
| Bachelor's Degree | 30.0% | 21.0% | 22.0% |
| Master's Degree | 12.0% | 7.0% | 10.0% |
| Professional Degree | 3.0% | 2.0% | 2.0% |
| Doctorate Degree | 2.0% | 1.0% | 2.0% |
Household Income For Boise City, Idaho
See the full breakdown
3.5% of households in Boise City earn Less than $10,000.
3.2% of households in Boise City earn $10,000 to $14,999.
5.4% of households in Boise City earn $15,000 to $24,999.
5.8% of households in Boise City earn $25,000 to $34,999.
10.5% of households in Boise City earn $35,000 to $49,999.
16.1% of households in Boise City earn $50,000 to $74,999.
15.0% of households in Boise City earn $75,000 to $99,999.
17.7% of households in Boise City earn $100,000 to $149,999.
10.5% of households in Boise City earn $150,000 to $199,999.
12.3% of households in Boise City earn $200,000 or more.
| Income | Boise City | ID | USA |
|---|---|---|---|
| Less than $10,000 | 3.5% | 3.6% | 5.0% |
| $10,000 to $14,999 | 3.2% | 2.7% | 3.4% |
| $15,000 to $24,999 | 5.4% | 6.1% | 6.3% |
| $25,000 to $34,999 | 5.8% | 6.6% | 6.6% |
| $35,000 to $49,999 | 10.5% | 11.0% | 10.1% |
| $50,000 to $74,999 | 16.1% | 18.1% | 15.5% |
| $75,000 to $99,999 | 15.0% | 14.7% | 12.6% |
| $100,000 to $149,999 | 17.7% | 19.3% | 17.5% |
| $150,000 to $199,999 | 10.5% | 8.7% | 9.6% |
| $200,000 or more | 12.3% | 9.2% | 13.4% |
Source: U.S. Census ACS 5-year estimates (2024)


