Twin Falls SnackAbility
Overall SnackAbility
Crime in Twin Falls summary. We use data from the FBI to determine the crime rates in Twin Falls. Key points include:
There were 863 total crimes in Twin Falls in the last reporting year.
The overall crime rate per 100,000 people in Twin Falls is 1,542.9 / 100k people.
The violent crime rate per 100,000 people in Twin Falls is 416.6 / 100k people.
The property crime rate per 100,000 people in Twin Falls is 1,126.4 / 100k people.
Overall, crime in Twin Falls is -27.19% below the national average.
Total Crimes
Below National Average
Crime In Twin Falls Comparison Table
| Statistic | Count Raw |
Twin Falls / 100k People |
Idaho / 100k People |
National / 100k People |
|---|---|---|---|---|
| Total Crimes Per 100K | 863 | 1,542.9 | 966.9 | 2,119.2 |
| Violent Crime | 233 | 416.6 | 230.6 | 359.0 |
| Murder | 3 | 5.4 | 1.6 | 5.0 |
| Robbery | 5 | 8.9 | 7.0 | 61.0 |
| Aggravated Assault | 174 | 311.1 | 177.3 | 256.0 |
| Property Crime | 630 | 1,126.4 | 736.3 | 1,760.0 |
| Burglary | 54 | 96.5 | 116.2 | 229.0 |
| Larceny | 530 | 947.6 | 552.6 | 1,272.0 |
| Car Theft | 46 | 82.2 | 67.4 | 259.0 |
Source: FBI Uniform Crime Reporting (2024)
Cost of living in Twin Falls summary. We use data on the cost of living to determine how expensive it is to live in Twin Falls. Real estate prices drive most of the variance in cost of living around Idaho. Key points include:
The cost of living in Twin Falls is 98 with 100 being average.
The cost of living in Twin Falls is 1.0x lower than the national average.
The median home value in Twin Falls is $367,063.
The median income in Twin Falls is $61,205.
Twin Falls's Overall Cost Of Living
Lower Than The National Average
Cost Of Living In Twin Falls Comparison Table
| Living Expense | Twin Falls | Idaho | National Average |
|---|---|---|---|
| Overall | 98 | 100 | 100 |
| Services | 101 | 100 | 100 |
| Groceries | 97 | 101 | 100 |
| Health | 91 | 89 | 100 |
| Housing | 105 | 104 | 100 |
| Transportation | 98 | 103 | 100 |
| Utilities | 104 | 107 | 100 |
Source: Cost of living index, normalized to US average = 100
Twin Falls, ID Weather
The average high in Twin Falls is 62.2° and the average low is 36.7°.
There are 30.2 days of precipitation each year.
Expect an average of 9.7 inches of precipitation each year with 15.1 inches of snow.
| Stat | Twin Falls |
|---|---|
| Average Annual High | 62.2 |
| Average Annual Low | 36.7 |
| Annual Precipitation Days | 30.2 |
| Average Annual Precipitation | 9.7 |
| Average Annual Snowfall | 15.1 |
Average High
Days of Rain
Source: NOAA climate normals (30-year)
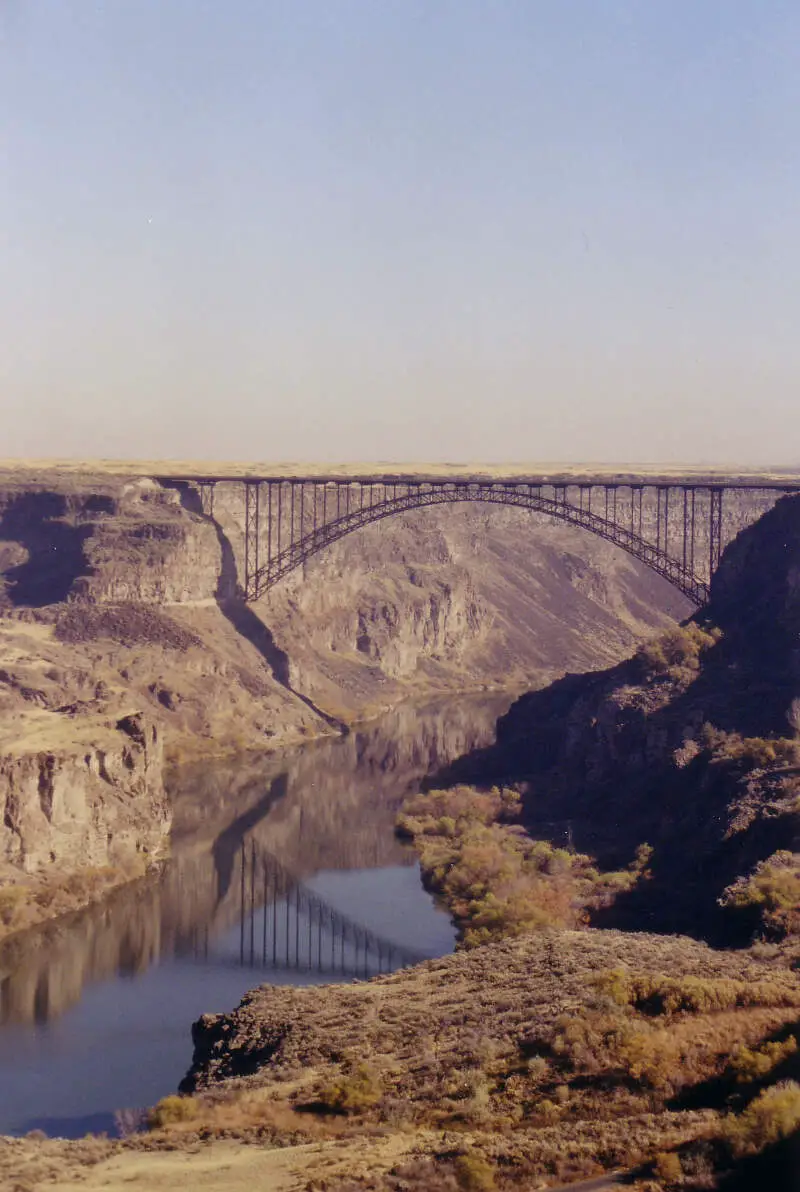
Twin Falls, ID Photos


1 Reviews & Comments About Twin Falls

I live there till I was 11 and I'm 34 now and back then I remember Not much older then me at time fighting and putting each other in wheel chairs slicing faces and necks, stabbing and shooting each other to death and it was like another day in the neighborhood. The way I explain it to my girlfriend is that it's a small town with a chip on its shoulder that no one knows of so they have too go the extreme to show that they are just as ruff as the big cities. Much like the youngest kids in the gang are the most dangerous cause they have more to prove. Anyways I live Seattle now. And miss Maxies and Papa kelseys but that's it. Oh and the schools s**k a*s. Nothing to do except cow tipping and trying not to date your cousins, yeah it's a thing...
Dirkys lake was my favorite place to go when i did live there which was right off the snake river down a lil canyon and if u hike behind that they which was called then the hidden lakes which was like 3 or 4 of them and u could go cliff jumping off of them, but lots of deaths probably 3 each year when I live there I think don't quote me on that, and the other thing which is really popular now, it wasnt so much when i lived there but I think they had to capitalize on it to help the city gain more publicity is base jumping off the bridge with a but I hear about 3-5 people die each year doin that too but has gained a lot of attention across the nation and the world I believe for the extreme seeking fanatics at are into that stuff.
Rankings & Articles For Twin Falls


Locations Around Twin Falls
Map Of Twin Falls, ID
Best Places Around Twin Falls
Rupert, ID
Population 6,190
Buhl, ID
Population 4,673
Jerome, ID
Population 12,930
Burley, ID
Population 11,958
Twin Falls Demographics And Statistics
Population over time in Twin Falls
The current population in Twin Falls is 54,164. The population has increased 27.6% from 2010.
| Year | Population | % Change |
|---|---|---|
| 2024 | 54,164 | 1.8% |
| 2023 | 53,219 | 1.7% |
| 2022 | 52,315 | 2.1% |
| 2021 | 51,223 | 2.8% |
| 2020 | 49,819 | 1.8% |
| 2019 | 48,951 | 1.5% |
| 2018 | 48,225 | 1.9% |
| 2017 | 47,340 | 1.5% |
| 2016 | 46,623 | 1.4% |
| 2015 | 45,984 | 1.4% |
| 2014 | 45,362 | 1.3% |
| 2013 | 44,758 | 1.5% |
| 2012 | 44,097 | 1.9% |
| 2011 | 43,287 | 2.0% |
| 2010 | 42,458 | - |
Race / Ethnicity in Twin Falls
See the full breakdown
Twin Falls is:
74.0% White with 40,106 White residents.
1.2% African American with 649 African American residents.
0.3% American Indian with 138 American Indian residents.
1.9% Asian with 1,044 Asian residents.
0.5% Hawaiian with 282 Hawaiian residents.
0.5% Other with 264 Other residents.
4.2% Two Or More with 2,299 Two Or More residents.
17.3% Hispanic with 9,382 Hispanic residents.
| Race | Twin Falls | ID | USA |
|---|---|---|---|
| White | 74.0% | 78.6% | 57.4% |
| African American | 1.2% | 0.7% | 11.9% |
| American Indian | 0.3% | 0.7% | 0.5% |
| Asian | 1.9% | 1.3% | 5.9% |
| Hawaiian | 0.5% | 0.1% | 0.2% |
| Other | 0.5% | 0.6% | 0.6% |
| Two Or More | 4.2% | 4.2% | 4.3% |
| Hispanic | 17.3% | 13.6% | 19.3% |
Gender in Twin Falls
See the full breakdown
Twin Falls is 50.3% female with 27,259 female residents.
Twin Falls is 49.7% male with 26,904 male residents.
| Gender | Twin Falls | ID | USA |
|---|---|---|---|
| Female | 50.3% | 49.7% | 50.5% |
| Male | 49.7% | 50.3% | 49.5% |
Highest level of educational attainment in Twin Falls for adults over 25
See the full breakdown
4.0% of adults in Twin Falls completed < 9th grade.
6.0% of adults in Twin Falls completed 9-12th grade.
30.0% of adults in Twin Falls completed high school / ged.
24.0% of adults in Twin Falls completed some college.
12.0% of adults in Twin Falls completed associate's degree.
16.0% of adults in Twin Falls completed bachelor's degree.
6.0% of adults in Twin Falls completed master's degree.
1.0% of adults in Twin Falls completed professional degree.
1.0% of adults in Twin Falls completed doctorate degree.
| Education | Twin Falls | ID | USA |
|---|---|---|---|
| < 9th Grade | 4.0% | 4.0% | 4.0% |
| 9-12th Grade | 6.0% | 5.0% | 6.0% |
| High School / GED | 30.0% | 26.0% | 26.0% |
| Some College | 24.0% | 24.0% | 19.0% |
| Associate's Degree | 12.0% | 10.0% | 9.0% |
| Bachelor's Degree | 16.0% | 21.0% | 22.0% |
| Master's Degree | 6.0% | 7.0% | 10.0% |
| Professional Degree | 1.0% | 2.0% | 2.0% |
| Doctorate Degree | 1.0% | 1.0% | 2.0% |
Household Income For Twin Falls, Idaho
See the full breakdown
3.2% of households in Twin Falls earn Less than $10,000.
4.0% of households in Twin Falls earn $10,000 to $14,999.
9.5% of households in Twin Falls earn $15,000 to $24,999.
8.7% of households in Twin Falls earn $25,000 to $34,999.
15.3% of households in Twin Falls earn $35,000 to $49,999.
18.4% of households in Twin Falls earn $50,000 to $74,999.
11.8% of households in Twin Falls earn $75,000 to $99,999.
18.1% of households in Twin Falls earn $100,000 to $149,999.
5.5% of households in Twin Falls earn $150,000 to $199,999.
5.6% of households in Twin Falls earn $200,000 or more.
| Income | Twin Falls | ID | USA |
|---|---|---|---|
| Less than $10,000 | 3.2% | 3.6% | 5.0% |
| $10,000 to $14,999 | 4.0% | 2.7% | 3.4% |
| $15,000 to $24,999 | 9.5% | 6.1% | 6.3% |
| $25,000 to $34,999 | 8.7% | 6.6% | 6.6% |
| $35,000 to $49,999 | 15.3% | 11.0% | 10.1% |
| $50,000 to $74,999 | 18.4% | 18.1% | 15.5% |
| $75,000 to $99,999 | 11.8% | 14.7% | 12.6% |
| $100,000 to $149,999 | 18.1% | 19.3% | 17.5% |
| $150,000 to $199,999 | 5.5% | 8.7% | 9.6% |
| $200,000 or more | 5.6% | 9.2% | 13.4% |
Source: U.S. Census ACS 5-year estimates (2024)


