East Chicago SnackAbility
Overall SnackAbility
Crime in East Chicago summary. We use data from the FBI to determine the crime rates in East Chicago. Key points include:
There were 620 total crimes in East Chicago in the last reporting year.
The overall crime rate per 100,000 people in East Chicago is 2,416.0 / 100k people.
The violent crime rate per 100,000 people in East Chicago is 826.1 / 100k people.
The property crime rate per 100,000 people in East Chicago is 1,589.9 / 100k people.
Overall, crime in East Chicago is 14.00% above the national average.
Total Crimes
Above National Average
Crime In East Chicago Comparison Table
| Statistic | Count Raw |
East Chicago / 100k People |
Indiana / 100k People |
National / 100k People |
|---|---|---|---|---|
| Total Crimes Per 100K | 620 | 2,416.0 | 1,691.5 | 2,119.2 |
| Violent Crime | 212 | 826.1 | 312.9 | 359.0 |
| Murder | 3 | 11.7 | 5.5 | 5.0 |
| Robbery | 21 | 81.8 | 34.5 | 61.0 |
| Aggravated Assault | 169 | 658.6 | 239.4 | 256.0 |
| Property Crime | 408 | 1,589.9 | 1,378.6 | 1,760.0 |
| Burglary | 37 | 144.2 | 176.8 | 229.0 |
| Larceny | 236 | 919.6 | 988.8 | 1,272.0 |
| Car Theft | 135 | 526.1 | 213.0 | 259.0 |
Source: FBI Uniform Crime Reporting (2024)
Cost of living in East Chicago summary. We use data on the cost of living to determine how expensive it is to live in East Chicago. Real estate prices drive most of the variance in cost of living around Indiana. Key points include:
The cost of living in East Chicago is 84 with 100 being average.
The cost of living in East Chicago is 0.8x lower than the national average.
The median home value in East Chicago is $128,170.
The median income in East Chicago is $42,125.
East Chicago's Overall Cost Of Living
Lower Than The National Average
Cost Of Living In East Chicago Comparison Table
| Living Expense | East Chicago | Indiana | National Average |
|---|---|---|---|
| Overall | 84 | 90 | 100 |
| Services | 98 | 97 | 100 |
| Groceries | 98 | 95 | 100 |
| Health | 51 | 72 | 100 |
| Housing | 94 | 98 | 100 |
| Transportation | 95 | 94 | 100 |
| Utilities | 90 | 96 | 100 |
Source: Cost of living index, normalized to US average = 100
East Chicago, IN Weather
The average high in East Chicago is 59.3° and the average low is 43.0°.
There are 73.9 days of precipitation each year.
Expect an average of 36.4 inches of precipitation each year with 31.2 inches of snow.
| Stat | East Chicago |
|---|---|
| Average Annual High | 59.3 |
| Average Annual Low | 43.0 |
| Annual Precipitation Days | 73.9 |
| Average Annual Precipitation | 36.4 |
| Average Annual Snowfall | 31.2 |
Average High
Days of Rain
Source: NOAA climate normals (30-year)
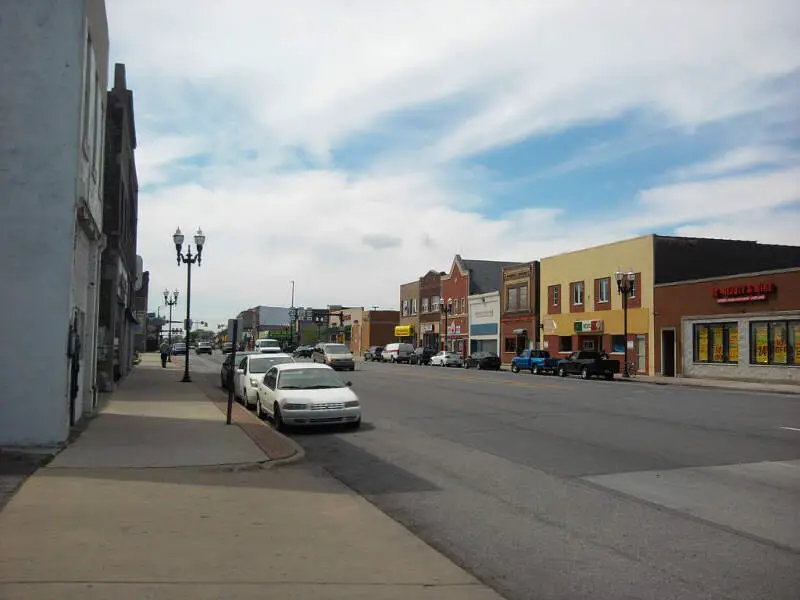
East Chicago, IN Photos

2 Reviews & Comments About East Chicago

I live in East Chicago and it is not bad at all
Crime is high. School are below average and do not follow state standards as far as enforcing attendance and grading. It is dirty and run down. The mayor throws an end if the year party for the school kids where drugs and alcohol are consumed and laws are not enforced.
Most of the people that are employed are employed by the city. The tax payers are paying for old buildings to be refaced even though there hasn't been a business in it for many years.
Rankings & Articles For East Chicago


Locations Around East Chicago
Map Of East Chicago, IN
Best Places Around East Chicago
Tinley Park, IL
Population 54,842
Flossmoor, IL
Population 9,391
Palos Heights, IL
Population 12,152
Oak Forest, IL
Population 26,805
Palos Hills, IL
Population 18,081
Worth, IL
Population 10,700
Evergreen Park, IL
Population 19,420
Homewood, IL
Population 19,294
Midlothian, IL
Population 13,948
Matteson, IL
Population 18,645
East Chicago Demographics And Statistics
Population over time in East Chicago
The current population in East Chicago is 26,022. The population has decreased 13.9% from 2010.
| Year | Population | % Change |
|---|---|---|
| 2024 | 26,022 | -0.5% |
| 2023 | 26,158 | -0.8% |
| 2022 | 26,363 | -0.5% |
| 2021 | 26,502 | -5.5% |
| 2020 | 28,044 | -0.6% |
| 2019 | 28,201 | -0.9% |
| 2018 | 28,448 | -1.0% |
| 2017 | 28,728 | -0.8% |
| 2016 | 28,961 | -0.7% |
| 2015 | 29,178 | -0.7% |
| 2014 | 29,387 | -0.7% |
| 2013 | 29,584 | -0.7% |
| 2012 | 29,789 | -0.7% |
| 2011 | 30,003 | -0.7% |
| 2010 | 30,218 | - |
Race / Ethnicity in East Chicago
See the full breakdown
East Chicago is:
6.1% White with 1,576 White residents.
36.1% African American with 9,386 African American residents.
0.0% American Indian with 3 American Indian residents.
0.0% Asian with 1 Asian residents.
0.0% Hawaiian with 0 Hawaiian residents.
0.2% Other with 44 Other residents.
0.5% Two Or More with 124 Two Or More residents.
57.2% Hispanic with 14,888 Hispanic residents.
| Race | East Chicago | IN | USA |
|---|---|---|---|
| White | 6.1% | 75.4% | 57.4% |
| African American | 36.1% | 9.1% | 11.9% |
| American Indian | 0.0% | 0.1% | 0.5% |
| Asian | 0.0% | 2.6% | 5.9% |
| Hawaiian | 0.0% | 0.0% | 0.2% |
| Other | 0.2% | 0.4% | 0.6% |
| Two Or More | 0.5% | 3.8% | 4.3% |
| Hispanic | 57.2% | 8.6% | 19.3% |
Gender in East Chicago
See the full breakdown
East Chicago is 51.1% female with 13,298 female residents.
East Chicago is 48.9% male with 12,724 male residents.
| Gender | East Chicago | IN | USA |
|---|---|---|---|
| Female | 51.1% | 50.4% | 50.5% |
| Male | 48.9% | 49.6% | 49.5% |
Highest level of educational attainment in East Chicago for adults over 25
See the full breakdown
12.0% of adults in East Chicago completed < 9th grade.
15.0% of adults in East Chicago completed 9-12th grade.
39.0% of adults in East Chicago completed high school / ged.
17.0% of adults in East Chicago completed some college.
7.0% of adults in East Chicago completed associate's degree.
7.0% of adults in East Chicago completed bachelor's degree.
2.0% of adults in East Chicago completed master's degree.
1.0% of adults in East Chicago completed professional degree.
0.0% of adults in East Chicago completed doctorate degree.
| Education | East Chicago | IN | USA |
|---|---|---|---|
| < 9th Grade | 12.0% | 3.0% | 4.0% |
| 9-12th Grade | 15.0% | 6.0% | 6.0% |
| High School / GED | 39.0% | 33.0% | 26.0% |
| Some College | 17.0% | 19.0% | 19.0% |
| Associate's Degree | 7.0% | 9.0% | 9.0% |
| Bachelor's Degree | 7.0% | 19.0% | 22.0% |
| Master's Degree | 2.0% | 8.0% | 10.0% |
| Professional Degree | 1.0% | 2.0% | 2.0% |
| Doctorate Degree | 0.0% | 1.0% | 2.0% |
Household Income For East Chicago, Indiana
See the full breakdown
12.5% of households in East Chicago earn Less than $10,000.
8.8% of households in East Chicago earn $10,000 to $14,999.
12.1% of households in East Chicago earn $15,000 to $24,999.
9.6% of households in East Chicago earn $25,000 to $34,999.
13.5% of households in East Chicago earn $35,000 to $49,999.
17.3% of households in East Chicago earn $50,000 to $74,999.
9.6% of households in East Chicago earn $75,000 to $99,999.
9.7% of households in East Chicago earn $100,000 to $149,999.
3.7% of households in East Chicago earn $150,000 to $199,999.
3.3% of households in East Chicago earn $200,000 or more.
| Income | East Chicago | IN | USA |
|---|---|---|---|
| Less than $10,000 | 12.5% | 4.9% | 5.0% |
| $10,000 to $14,999 | 8.8% | 3.4% | 3.4% |
| $15,000 to $24,999 | 12.1% | 6.8% | 6.3% |
| $25,000 to $34,999 | 9.6% | 7.5% | 6.6% |
| $35,000 to $49,999 | 13.5% | 11.8% | 10.1% |
| $50,000 to $74,999 | 17.3% | 17.7% | 15.5% |
| $75,000 to $99,999 | 9.6% | 13.9% | 12.6% |
| $100,000 to $149,999 | 9.7% | 17.5% | 17.5% |
| $150,000 to $199,999 | 3.7% | 8.3% | 9.6% |
| $200,000 or more | 3.3% | 8.2% | 13.4% |
Source: U.S. Census ACS 5-year estimates (2024)


