As any good midwesterner knows, the best places to live in Indiana are not just part of flyover territory.
There’s a reason Indiana’s motto is ‘Crossroads of America. ‘ Indiana’s best places have much to offer. You could have a great weekend in cities like Indianapolis and Evansville, visit the many State Parks, or drive through field after field of corn and soybeans.
To find the best places in Indiana, we used Saturday Night Science to compare Census, FBI, and Zillow data on incomes, crime, and home prices among other factors. We analyzed 117 Indiana cities over 5,000 people.
Grab a fried tenderloin and read on to see what Indiana cities made the top ten.
$172,024 median income · $680,117 median home · #1 best place in Indiana
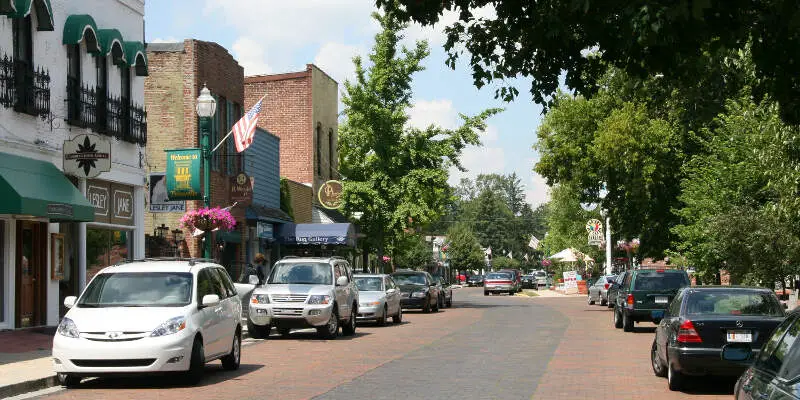
Zionsville consistently ranks as one of the best places to live in Indiana. On our list, Zionsville moved up five places to score the title “The 1st Best Place to live in Indiana for 2026.” This small town of 32,095 residents has one of the most idyllic Main Streets in the Hoosier State and one of the best farmers’ markets, too.
Quite frankly, you’d be pretty lucky to call Zionsville home, as the cost of living here is quite a bit higher than the national average. The homes in Zionsville are the most expensive in the Indiana, with the average home worth a whopping $680,117. We’re not elitists, nor are we saying that big homes means a better place to live; but, price reflects demand, and simply put, a lot of people want to live in Zionsville if they can afford it. Zionsville is after all one of the fastest growing cities in Indiana. However if you want to live comfortably here, you’re going to have to make $172,024/year.
Data | Crime | Cost of living | Movers
$122,789 median income · $468,588 median home · #2 best place in Indiana
Located just a stone’s throw north of Carmel, up “the 31,” is Indiana’s 2nd best place to live, Westfield.
Westfield’s low crime rate tells us a couple of things: one, this city in Hamilton County has the 25th lowest crime rate: it’s over 60% below the state and national average. To put this in perspective, there were only 400 crimes committed here last year, and a majority of them were property related. And, two, the lack of crime inside “The Crossroads of Indiana” has allowed this city to focus their funds and attention on jobs and education, and it shows: Westfield has the 25th best unemployment rate in Indiana and the poverty rate here is well below the national average at 3.6%. In terms of education, Westfield spends close to $11,000/student and it shows as they have the 2nd lowest high school dropout rate in the state.
To get your hands on such a great place, you’re going to have to make at least $122,789/year. And if you want to buy a home in Westfield, you’ll be paying the 4th home price in the state, $468,588.
Data | Crime | Cost of living | Movers

$141,505 median income · $563,458 median home · #3 best place in Indiana
Three of the top ten best places to live in Indiana scored a perfect 10/10 on our SnackAbility scale and the #3 best place, Carmel led the way. Carmel is no stranger to these lists as this city wears many hats: it’s one of the richest places in The Hoosier State
and
Yes, it’s pretty fancy in Carmel. In fact, if you live anywhere near Indianapolis, you hop on the I-465 and make the trek to Carmel if you want to shop at the “fancy” stores. And while we agree that shopping at the Clay Terrace outdoor shopping center is quite an experience with its first class stores and restaurants, a dog park, and a kid play area, if you’re one of Carmel’s 101,651 residents, you know that there’s more to this city than a great pair of shoes. If you get the chance to live in Indiana’s best of the best, just know that you will be amongst a bunch of hard-working 41-year-olds who make the 2nd highest household income in the state at $141,505/year. Their motto is “A Partnership for Tomorrow,” and it seems to be working: Carmel has some of the best schools in Indiana.
Data | Crime | Cost of living | Movers
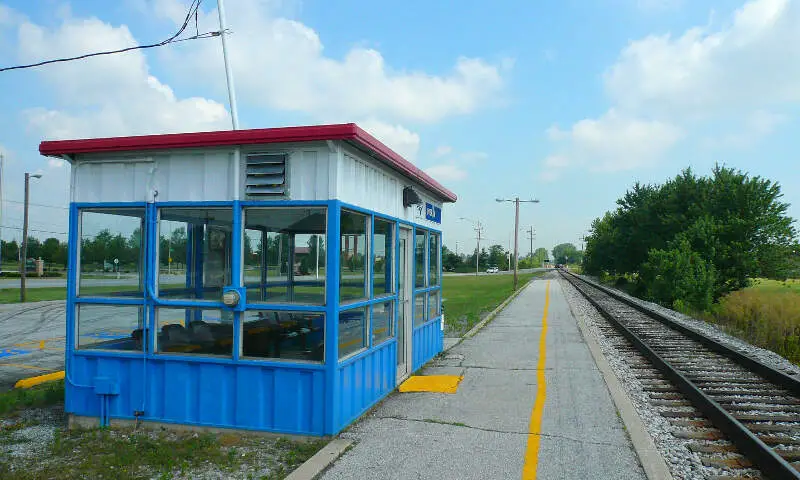
$66,934 median income · $401,400 median home · #4 best place in Indiana
Cicero, in Hamilton County just north of Indianapolis, offers residents a median home value of $401,400 and a median income of 66,934, coupled with a competitive 0.8% unemployment rate.
41% of adults have an advanced degree, while crime rates sit at 0.0011 per capita for violent crime and 0.0020 for property crime.
Data | Crime | Cost of living | Movers
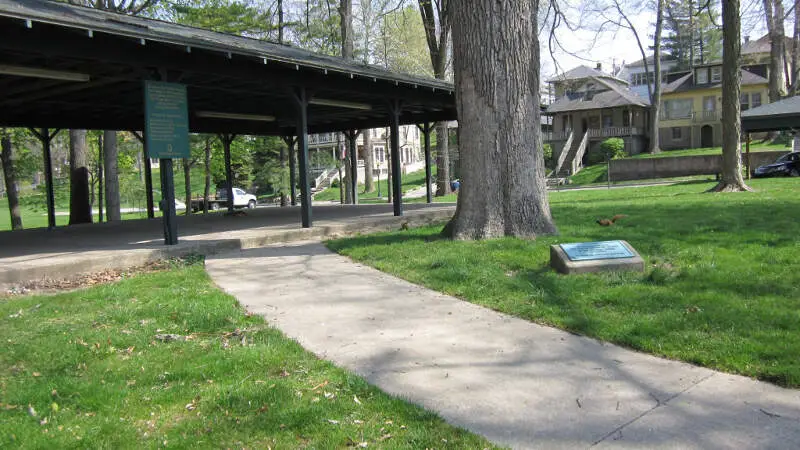
$82,188 median income · $297,378 median home · #5 best place in Indiana
Winona Lake, located in Kosciusko County, Indiana, is a fantastic place to call home. Its picturesque lake and charming atmosphere offer residents a high quality of life. The town is known for its low cost of living, making it one of the best places to live in Indiana. The median home price in Winona Lake is $297,378, which is quite affordable compared to other areas in the state. Additionally, the town has a strong sense of community and a safe environment, with low crime rates and a tight-knit population.
One of the main attractions of Winona Lake is its namesake lake itself. Residents can enjoy various water activities such as boating, fishing, and swimming. The town is also home to the Winona Lake Historic District, which showcases beautiful historic homes and buildings that reflect its rich history as a Chautauqua and Bible conference hotspot. Furthermore, Winona Lake is conveniently located near Warsaw, allowing residents easy access to shopping, dining, and entertainment options.
Data | Crime | Cost of living | Movers
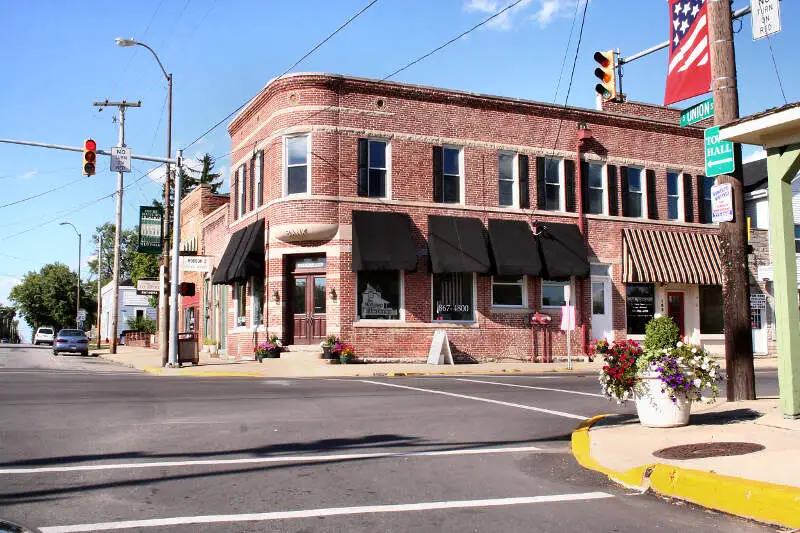
$107,159 median income · $355,530 median home · #6 best place in Indiana
Go ahead and “Wander Indiana,” but when your done, Dyer will still be the 6th best place to live in the state and one of the best places to buy your forever home if you make $107,159/year. And word on the street, you can find a real estate deal in the $200,000 range in one of the new subdivisions off of Towle Street.
And when you’re not busy making Indiana’s 10th highest income in one of the safest places in Indiana, a quick Saturday trip to South Bend to watch one of Indiana’s treasures, Notre Dame’s Fighting Irish or a weekend beach trip to Michigan City is not only super easy, it’s super fun.
The only downside to this great place in Lake County, the unemployment rate here is 3.8%: the 47th highest in the state. If Dyer can get some more of their residents to work, things could be better.
Data | Crime | Cost of living | Movers
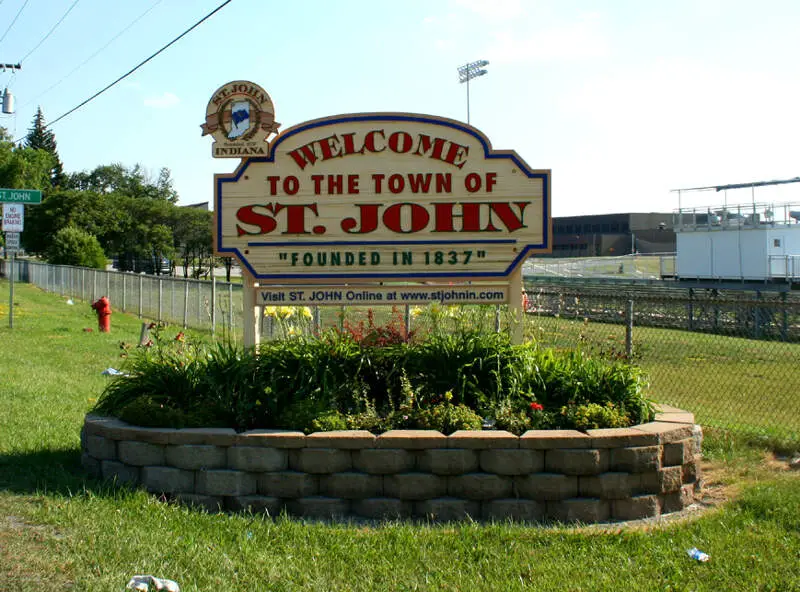
$131,467 median income · $450,806 median home · #7 best place in Indiana
Located off U.S. Route 41 in Northern Indiana, St. John is the 7th best place to live in the state. It is also the third city to score a perfect 10/10 on our SnackAbility scale with high marks in jobs, safety, and education.
This city in Lake County is no stranger to accolades and badges. In fact, CNN once ranked St. John one of the top 100 places to live in the United States; and, here they are again, in our headlines. This is why: St. John has the 5th highest home price in the state. Economically speaking, higher home prices generally mean higher incomes which, in turn, trickles down to better schools and safer streets. Folks, the household median income in St. John is the 4th highest in Indiana at $131,467/year. This median income combined with hard working school officials has helped produce one of the lowest high school dropout rates in the state. And parents, you can also rest easy knowing that your family is safe in St. John as the crime rate here is 75% below the state and national level making it one of the safest places in Hoosier-land.
Yes, they take safety pretty seriously. In fact, if we could give you one piece of advice in regards to living in St. John, don’t speed on their main thoroughfare, U.S. Route 41……
Data | Crime | Cost of living | Movers
$102,235 median income · $356,184 median home · #8 best place in Indiana
Coming in as the 8th best place to live in Indiana is Brownsburg, a town that sits west of Indianapolis. The area is known for hosting the NHRA U.S. Nationals drag race and the Night Before the 500 event at the Lucas Oil Raceway. Both occasions bring a swath of visitors to the area each year, but we bet if they knew how good life is here, those tourists would plan to stay permanently.
For one, the affordable cost of living in Brownsburg means every penny of the $102,235 median household income its residents earn goes a lot further here than it would elsewhere. The city’s median home value of $356,184 being a prime example.
On top of that, parents who move to this town of 31,215 can say goodbye to limiting their home search to just one area with good schools. Practically all the education facilities here earn high ratings from GreatSchools, ranging from 8/10 to 10/10.
Data | Crime | Cost of living | Movers
$104,047 median income · $389,215 median home · #9 best place in Indiana
If you didn’t grow up heading to Deer Creek to hear the latest music in Indiana’s 9th best place to live, Noblesville, you missed out. And while Noblesville might be home to Indiana’s largest amphitheater and some pretty amazing, smart midwesterners, it’s the numbers that really make this noble gem shine.
First off, over half the city’s 73,362 residents have some type of college degree. To keep up with the nobility and the city’s cost of living, you’re going to have to make a median household income of $104,047/year because homes here cost $389,215. Noblesville is after all, one of the richest places in Indiana.
But, if you’re not ready to go all in, rent in Noblesville is below the state average at $1,389/month and this is a great way to get your feet wet without breaking your bank. And speaking of banks, you and your money will be safe here. Nobleville’s crime rate is 60% below the national average.
Data | Crime | Cost of living | Movers
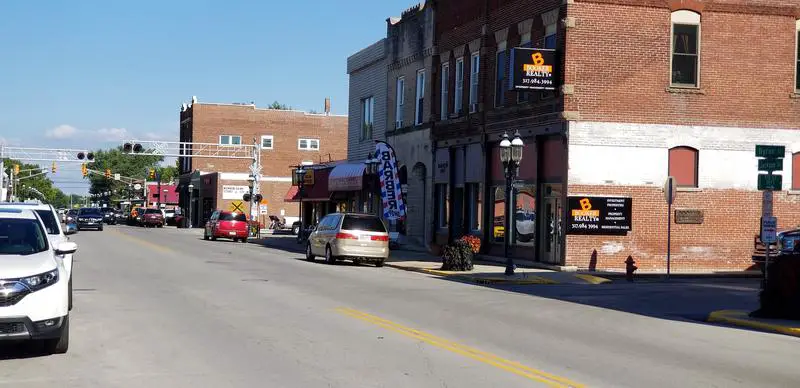
$101,686 median income · $354,995 median home · #10 best place in Indiana
If you very much dislike writing that check to your mortgage lender and your utility companies every month, just know that you will be writing it for less in Indiana’s 10th best place to live, Crown Point, as the cost of living here is well below the national average.
Another Northern Indiana gem to make our top ten list, Crown Point makes it easy to enjoy the things that matter in life because they’ve taken care of the hard stuff. When it comes to low crime, Crown Point is getting the job done: the crime rate here is 55% below the state and national average. There were only 214 crimes reported this past year and 187 were property related. Now, it wouldn’t be right if we didn’t mention the outstanding education system in this small town of 34,393 residents: Crown Point has one of Indiana’s 111 Blue Ribbon Schools, Dwight D Eisenhower Elementary and the rest of the city’s great schools show no signs of slowing down. At this rate, we’re pretty sure that the only thing that could possibly make Crown Point better would be a Portillos like the one in your sister city, Merrillville.
Data | Crime | Cost of living | Movers
The receipts
Compare the top ten
Pick a metric. The bars rescale. The red line is Indiana’s statewide median.
Indiana statewide median: $71,957
Indiana statewide median: $254,122
Indiana statewide median: 4.3%
On the map
Mapping The Best And Worst Places To Live in Indiana
Saturday Night Science
Methodology: How We Calculated The Best Cities To Live In Indiana
Before we even started to collect data on the best places to live in Indiana, we had to answer a tough question: Is it fair to pit cities with populations over 100,000 against places with a population of 18?
We firmly decided no, that just isn’t fair.
So, to create our ranking, we broke the best places to live into three tiers:
- Cities — Populations over 5,000
- Towns — Populations between 1,000 and 5,000
- Small Towns — Populations below 1,000
We then decided no matter how much anyone loves their town, the best cities to live in Indiana have more of everything, and therefore, you need over 5,000 people to truly be ‘the best.’
Now that we had our set of the best possible cities, it was time to rank them using Saturday Night Science.
We ranked each place in Indiana across a number of criteria from one to 117, with one being the best.
We then took the average rank across all criteria, crowning the city posting the lowest overall score, the “Best Place To Live In Indiana.”
The criteria we looked to determine the best places were:
- Median Home Values
- Median Income
- Population Density (Higher is better)
- Unemployment Rate
- Commute Time
- Crime
- Education Levels
- Health Insurance Coverage
- Poverty rates
Sources of criteria include the New Census Data, FBI Crime Data, and Zillow. We updated this article for 2026. This report is our eleventh time ranking Indiana’s best places to live.
If your city or town isn’t among the top 10, jump down to the bottom of the post to see a detailed chart of the best places in Indiana. Otherwise, buckle up for a ride down good living lane with Zionsville at the end of the cul-de-sac.
The full plate
Best Places To Live In Indiana Table
Click any column to sort. Search by city name.
| Rank | City | Best Score | Population | Unemployment Rate | Home Value | Median Income | Rent | Total Crime /100k |
|---|---|---|---|---|---|---|---|---|
| 1 | Zionsville | 20.65 | 32,095 | 2.8% | $680,117 | $172,024 | 308 | |
| 2 | Westfield | 22.28 | 54,677 | 2.8% | $468,588 | $122,789 | 775 | |
| 3 | Carmel | 23.95 | 101,651 | 2.7% | $563,458 | $141,505 | 891 | |
| 4 | Cicero | 24.70 | 5,509 | 0.8% | $401,400 | $66,934 | 309 | |
| 5 | Winona Lake | 25.20 | 5,080 | 1.4% | $297,378 | $82,188 | 374 | |
| 6 | Dyer | 25.75 | 16,400 | 3.8% | $355,530 | $107,159 | 354 | |
| 7 | St. John | 26.85 | 22,567 | 2.3% | $450,806 | $131,467 | 168 | |
| 8 | Brownsburg | 31.15 | 31,215 | 1.6% | $356,184 | $102,235 | 708 | |
| 9 | Noblesville | 32.10 | 73,362 | 2.9% | $389,215 | $104,047 | 638 | |
| 10 | Crown Point | 32.85 | 34,393 | 2.8% | $354,995 | $101,686 | 622 | |
| 11 | Danville | 33.00 | 11,714 | 2.1% | $337,029 | $97,083 | 820 | |
| 12 | Munster | 33.55 | 23,733 | 5.5% | $347,952 | $110,187 | 1,070 | |
| 13 | White | 34.70 | 12,466 | 1.6% | $434,989 | $123,643 | 1,269 | |
| 14 | Columbus | 35.45 | 51,824 | 4.7% | $276,890 | $77,456 | 96 | |
| 15 | Greenwood | 38.10 | 66,029 | 2.6% | $326,491 | $83,608 | 1,664 | |
| 16 | New Whiteland | 38.55 | 5,704 | 0.0% | $228,047 | $89,918 | 1,664 | |
| 17 | Lowell | 39.70 | 11,073 | 4.9% | $329,211 | $84,024 | 235 | |
| 18 | Valparaiso | 39.95 | 34,733 | 3.6% | $355,845 | $69,872 | 875 | |
| 19 | Auburn | 40.05 | 13,565 | 5.9% | $275,151 | $68,750 | 442 | |
| 20 | Avon | 40.05 | 23,437 | 2.9% | $352,859 | $98,486 | 1,869 | |
| 21 | Ellettsville | 40.40 | 6,698 | 1.3% | $274,445 | $90,213 | 2,957 | |
| 22 | West Lafayette | 41.00 | 45,159 | 4.5% | $363,861 | $34,891 | 1,291 | |
| 23 | Cedar Lake | 41.20 | 15,295 | 5.5% | $328,156 | $83,381 | 360 | |
| 24 | Schererville | 41.35 | 29,701 | 5.1% | $352,735 | $89,466 | 1,387 | |
| 25 | Batesville | 41.55 | 7,282 | 2.5% | $317,505 | $62,292 | 330 | |
| 26 | Jasper | 42.00 | 15,991 | 1.4% | $266,264 | $68,817 | 763 | |
| 27 | Bargersville | 43.60 | 10,752 | 6.7% | $442,137 | $114,231 | 521 | |
| 28 | Franklin | 43.85 | 26,168 | 3.9% | $279,168 | $82,380 | 1,169 | |
| 29 | Whiteland | 43.95 | 5,173 | 2.3% | $296,965 | $96,944 | 967 | |
| 30 | Griffith | 45.15 | 16,273 | 3.8% | $247,099 | $76,636 | 1,106 | |
| 31 | Mount Vernon | 45.20 | 6,400 | 3.9% | $221,083 | $62,263 | 1,125 | |
| 32 | McCordsville | 45.40 | 10,329 | 2.4% | $375,788 | $110,692 | 1,220 | |
| 33 | Greensburg | 45.50 | 12,229 | 2.3% | $261,666 | $62,655 | 1,627 | |
| 34 | Pendleton | 45.55 | 5,321 | 5.2% | $334,739 | $86,806 | 94 | |
| 35 | Chesterton | 48.45 | 14,446 | 6.7% | $340,855 | $91,060 | 1,365 | |
| 36 | Garrett | 49.50 | 6,642 | 4.6% | $187,134 | $64,179 | 752 | |
| 37 | Charlestown | 50.10 | 8,294 | 4.0% | $302,064 | $77,288 | 868 | |
| 38 | Cumberland | 50.30 | 6,267 | 3.7% | $289,409 | $87,364 | 2,808 | |
| 39 | Porter | 50.50 | 5,217 | 6.5% | $297,623 | $74,542 | 211 | |
| 40 | Westville | 51.30 | 5,279 | 3.7% | $357,284 | $60,794 | 1,853 | |
| 41 | New Haven | 51.35 | 15,698 | 4.8% | $240,073 | $70,970 | 1,325 | |
| 42 | Greenfield | 51.55 | 24,940 | 3.3% | $285,066 | $76,127 | 2,808 | |
| 43 | Huntington | 52.50 | 17,030 | 4.6% | $192,024 | $56,520 | 393 | |
| 44 | Sellersburg | 53.60 | 10,137 | 5.5% | $296,867 | $72,179 | 3,552 | |
| 45 | Plainfield | 53.60 | 36,369 | 3.6% | $331,618 | $87,272 | 1,760 | |
| 46 | Winfield | 54.05 | 7,816 | 3.0% | $476,915 | $135,870 | 3,759 | |
| 47 | Bluffton | 54.20 | 10,529 | 2.8% | $183,603 | $57,539 | 912 | |
| 48 | Greencastle | 55.20 | 9,864 | 3.0% | $243,386 | $55,565 | 2,453 | |
| 49 | Boonville | 56.10 | 6,702 | 2.6% | $230,217 | $63,580 | 2,074 | |
| 50 | Decatur | 56.35 | 9,811 | 2.7% | $229,668 | $58,646 | 866 | |
| 51 | Frankfort | 57.10 | 15,917 | 3.0% | $209,856 | $57,412 | 1,200 | |
| 52 | Jeffersonville | 57.30 | 51,043 | 4.0% | $251,611 | $70,930 | 2,018 | |
| 53 | Seymour | 58.40 | 22,371 | 2.3% | $230,829 | $64,426 | 1,560 | |
| 54 | Mooresville | 58.80 | 9,751 | 3.4% | $308,099 | $68,983 | 2,453 | |
| 55 | Lawrence | 59.25 | 49,517 | 4.5% | $268,725 | $74,022 | 2,007 | |
| 56 | Tipton | 59.55 | 5,280 | 1.7% | $237,894 | $59,828 | 473 | |
| 57 | Nappanee | 59.70 | 6,815 | 6.0% | $288,904 | $68,892 | 866 | |
| 58 | Bloomington | 59.75 | 80,049 | 6.6% | $313,960 | $50,465 | 2,957 | |
| 59 | Shelbyville | 60.00 | 20,296 | 2.0% | $222,049 | $55,602 | 1,306 | |
| 60 | Bedford | 60.15 | 13,837 | 2.3% | $207,924 | $49,553 | 304 | |
| 61 | Angola | 60.45 | 9,408 | 6.3% | $302,980 | $64,540 | 2,370 | |
| 62 | Warsaw | 60.55 | 16,768 | 2.3% | $271,691 | $61,035 | 2,099 | |
| 63 | Lebanon | 60.55 | 17,812 | 3.7% | $299,032 | $65,154 | 1,269 | |
| 64 | La Porte | 60.55 | 22,449 | 3.5% | $271,481 | $59,307 | 1,853 | |
| 65 | Kendallville | 61.05 | 10,556 | 3.3% | $220,523 | $58,939 | 881 | |
| 66 | Lawrenceburg | 61.35 | 5,179 | 1.6% | $248,401 | $51,250 | 2,453 | |
| 67 | New Castle | 61.60 | 17,367 | 4.9% | $164,336 | $51,606 | 806 | |
| 68 | Beech Grove | 62.30 | 14,913 | 4.4% | $191,935 | $49,973 | 1,857 | |
| 69 | Hobart | 62.55 | 29,558 | 4.3% | $238,196 | $75,160 | 2,402 | |
| 70 | Portage | 62.80 | 38,082 | 7.4% | $264,578 | $76,276 | 1,365 | |
| 71 | Lafayette | 63.40 | 71,159 | 3.6% | $262,731 | $53,716 | 2,650 | |
| 72 | Crawfordsville | 64.15 | 16,491 | 4.4% | $219,773 | $55,033 | 837 | |
| 73 | Martinsville | 64.60 | 11,933 | 4.4% | $288,805 | $60,177 | 2,453 | |
| 74 | Princeton | 65.80 | 8,372 | 2.8% | $187,283 | $57,618 | 2,453 | |
| 75 | Madison | 66.05 | 12,223 | 5.2% | $240,680 | $61,183 | 2,453 | |
| 76 | Speedway | 66.10 | 13,968 | 5.8% | $236,684 | $60,147 | 2,828 | |
| 77 | Washington | 67.35 | 12,367 | 2.8% | $147,888 | $50,331 | 760 | |
| 78 | Wabash | 67.65 | 10,358 | 4.4% | $179,809 | $53,410 | 2,453 | |
| 79 | Kokomo | 67.90 | 59,122 | 6.2% | $180,398 | $55,360 | 1,930 | |
| 80 | New Albany | 68.45 | 37,581 | 6.0% | $235,058 | $54,710 | 2,658 | |
| 81 | Fort Wayne | 68.50 | 268,589 | 5.6% | $242,385 | $61,422 | 2,562 | |
| 82 | Mishawaka | 68.60 | 51,021 | 6.8% | $206,367 | $54,291 | 2,793 | |
| 83 | Logansport | 68.80 | 17,790 | 4.3% | $153,143 | $47,291 | 1,315 | |
| 84 | Goshen | 69.00 | 34,420 | 4.0% | $275,120 | $59,184 | 2,687 | |
| 85 | Elwood | 69.50 | 8,356 | 6.2% | $148,429 | $53,280 | 562 | |
| 86 | Vincennes | 70.15 | 16,586 | 5.2% | $164,630 | $53,637 | 2,623 | |
| 87 | Scottsburg | 70.30 | 7,362 | 4.2% | $187,044 | $38,578 | 1,388 | |
| 88 | Alexandria | 70.60 | 5,155 | 7.2% | $182,198 | $64,317 | 2,675 | |
| 89 | Monticello | 70.70 | 5,496 | 5.9% | $235,505 | $52,798 | 2,453 | |
| 90 | Rushville | 71.10 | 6,036 | 5.6% | $202,258 | $53,434 | 2,453 | |
| 91 | Clarksville | 73.15 | 22,016 | 5.2% | $203,069 | $60,467 | 3,552 | |
| 92 | Huntingburg | 73.50 | 6,396 | 5.4% | $240,498 | $54,421 | 594 | |
| 93 | Rochester | 74.80 | 6,215 | 7.7% | $210,468 | $57,008 | 2,453 | |
| 94 | Plymouth | 75.20 | 10,664 | 3.4% | $238,868 | $58,623 | 2,453 | |
| 95 | Evansville | 75.50 | 116,116 | 5.1% | $198,977 | $53,387 | 4,824 | |
| 96 | Marion | 77.00 | 27,531 | 7.7% | $136,313 | $43,343 | 1,235 | |
| 97 | Indianapolis | 77.40 | 885,860 | 5.1% | $229,209 | $66,219 | 4,237 | |
| 98 | Rensselaer | 77.65 | 5,573 | 5.8% | $242,741 | $60,331 | 2,453 | |
| 99 | Portland | 77.65 | 6,416 | 5.0% | $162,775 | $51,513 | 2,453 | |
| 100 | Winchester | 79.35 | 5,284 | 5.0% | $152,403 | $52,439 | 2,453 |
Source: U.S. Census ACS 2020-2024, FBI UCR, Zillow research. 117 places with more than 5,000 residents.
Summary
Summary: The Best Places In Indiana
If you’re looking at areas in Indiana with the best economic situations, where there’s lower than average crime, and a lot to do, this is an accurate list.
The best places to live in Indiana are Zionsville, Westfield, Carmel, Cicero, Winona Lake, Dyer, St. John, Brownsburg, Noblesville, and Crown Point.
Zionsville made a strong showing to take in the overall number one spot for the best place to live in Indiana for 2026.