Monroe SnackAbility
Overall SnackAbility
Crime in Monroe summary. We use data from the FBI to determine the crime rates in Monroe. Key points include:
There were 3,530 total crimes in Monroe in the last reporting year.
The overall crime rate per 100,000 people in Monroe is 7,625.8 / 100k people.
The violent crime rate per 100,000 people in Monroe is 1,892.4 / 100k people.
The property crime rate per 100,000 people in Monroe is 5,733.4 / 100k people.
Overall, crime in Monroe is 259.84% above the national average.
Total Crimes
Above National Average
Crime In Monroe Comparison Table
| Statistic | Count Raw |
Monroe / 100k People |
Louisiana / 100k People |
National / 100k People |
|---|---|---|---|---|
| Total Crimes Per 100K | 3,530 | 7,625.8 | 2,816.2 | 2,119.2 |
| Violent Crime | 876 | 1,892.4 | 519.8 | 359.0 |
| Murder | 7 | 15.1 | 10.8 | 5.0 |
| Robbery | 76 | 164.2 | 39.4 | 61.0 |
| Aggravated Assault | 779 | 1,682.9 | 436.0 | 256.0 |
| Property Crime | 2,654 | 5,733.4 | 2,296.4 | 1,760.0 |
| Burglary | 649 | 1,402.0 | 405.4 | 229.0 |
| Larceny | 1,841 | 3,977.1 | 1,636.2 | 1,272.0 |
| Car Theft | 164 | 354.3 | 254.8 | 259.0 |
Source: FBI Uniform Crime Reporting (2024)
Cost of living in Monroe summary. We use data on the cost of living to determine how expensive it is to live in Monroe. Real estate prices drive most of the variance in cost of living around Louisiana. Key points include:
The cost of living in Monroe is 90 with 100 being average.
The cost of living in Monroe is 0.9x lower than the national average.
The median home value in Monroe is $149,717.
The median income in Monroe is $40,505.
Monroe's Overall Cost Of Living
Lower Than The National Average
Cost Of Living In Monroe Comparison Table
| Living Expense | Monroe | Louisiana | National Average |
|---|---|---|---|
| Overall | 90 | 91 | 100 |
| Services | 99 | 97 | 100 |
| Groceries | 97 | 97 | 100 |
| Health | 79 | 82 | 100 |
| Housing | 101 | 97 | 100 |
| Transportation | 102 | 99 | 100 |
| Utilities | 94 | 96 | 100 |
Source: Cost of living index, normalized to US average = 100
Monroe, LA Weather
The average high in Monroe is 76.3° and the average low is 53.5°.
There are 70.4 days of precipitation each year.
Expect an average of 56.1 inches of precipitation each year with 0.6 inches of snow.
| Stat | Monroe |
|---|---|
| Average Annual High | 76.3 |
| Average Annual Low | 53.5 |
| Annual Precipitation Days | 70.4 |
| Average Annual Precipitation | 56.1 |
| Average Annual Snowfall | 0.6 |
Average High
Days of Rain
Source: NOAA climate normals (30-year)
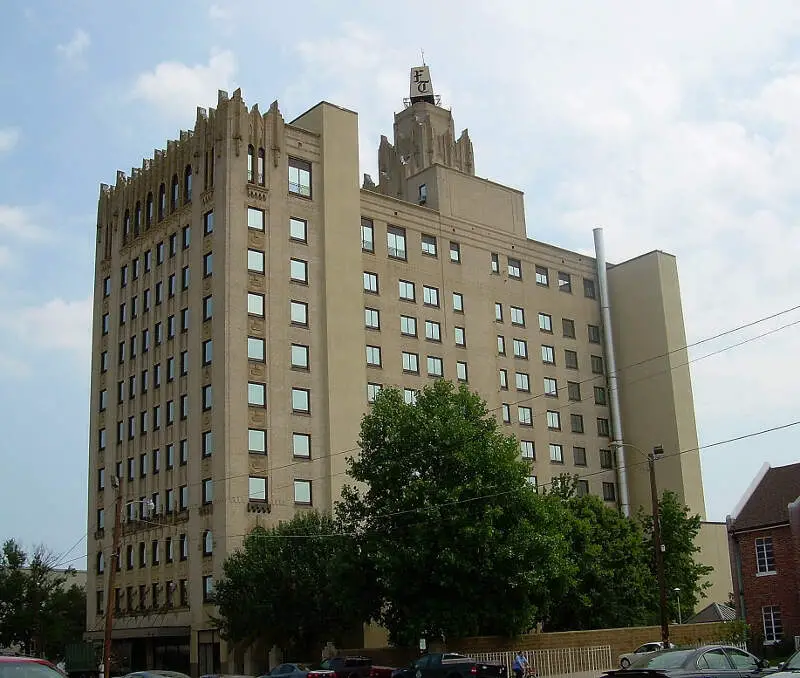
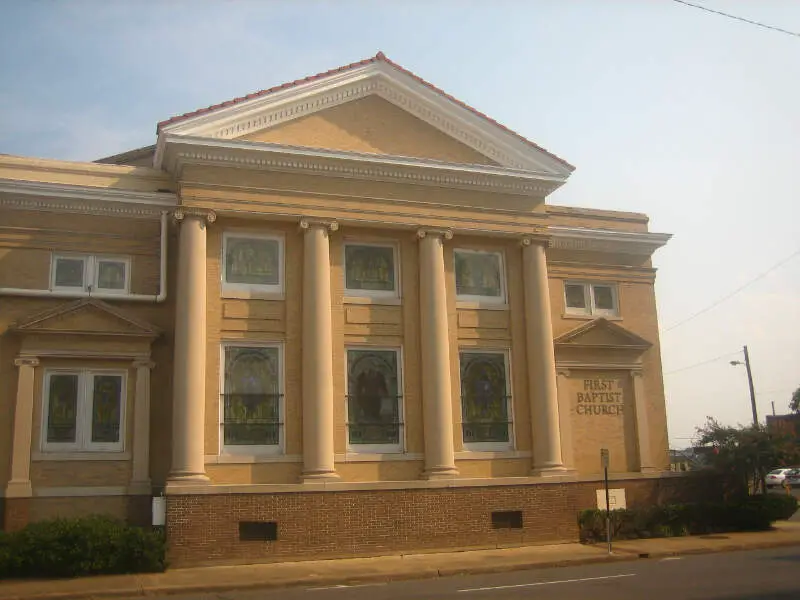
Monroe, LA Photos


3 Reviews & Comments About Monroe

i live in monroe. i just found out today that it's the most dangerous city in the us. i always knew that it wasn't the best place to live in but seriously- has jackson street really gotten that bad-
I left Monroe 4 years ago because I could see the townhill spiral then. The city is poor, crime is rising, increase in drugs, and businesses are leaving and none coming in. My sister who lives there does not feel comfortable herself. The largest employer, Century Link, has executives in Denver running the Company, because no one wants to move to Monroe. In 2020, the Company willl be allowed to leave and will. This is sad but true.
The encroachment of crime is now in North Monroe in the nicest neighborhoods. Property value is down. Residents are moving out.
This article speaks the truth. Monroe is a horrible city to live in. I knew it was bad, but the highest rate of violent crimes in the country just a year ago and third this year, yikes. It seems to me to have been on a downward slide for quite a while now too. A very poor city indeed, and it shows everywhere you look. It is one of the poorest looking, eyesores I have ever seen for a town of its size, at least in the city limits. The schools could be better, but I have seen much worse in this area of the state. That's probably one of the only things that doesn't line up with this awful place. For the highest per capita violent crime in the nation, you would think the schools would be much worse...very strange. Extreme poverty and rampant drug use are the biggest factors imo, and we have them both in spades. I would bet Monroe has some of the highest per capita users of drugs in the country as well, specifically m**h, crack, and opioids. And if you spend much time here, I hope you have a very good imagination and are easily entertained, because there is literally NOTHING TO DO...ever. I think the constant boredom that comes with a place like this is probably another driving force in the rampant criminal behavior here. I am suddenly overcome with the desire to move...
There is absolutely nothing special or memorable about this place at all. Everyone that will inevitably have some great praise to sing about anything in this town has clearly never been very far from this town. Monroe is worse than mediocrity in just about everything imaginable.
Rankings & Articles For Monroe


Locations Around Monroe
Map Of Monroe, LA
Best Places Around Monroe
Bastrop, LA
Population 9,232
Ruston, LA
Population 22,284
West Monroe, LA
Population 12,729
Claiborne, LA
Population 13,308
Crossett, AR
Population 4,639
Monroe Demographics And Statistics
Population over time in Monroe
The current population in Monroe is 47,004. The population has decreased 4.6% from 2010.
| Year | Population | % Change |
|---|---|---|
| 2024 | 47,004 | -0.5% |
| 2023 | 47,241 | -0.8% |
| 2022 | 47,631 | -1.0% |
| 2021 | 48,105 | 0.4% |
| 2020 | 47,906 | -0.7% |
| 2019 | 48,241 | -0.9% |
| 2018 | 48,663 | -0.6% |
| 2017 | 48,938 | -0.9% |
| 2016 | 49,361 | -0.3% |
| 2015 | 49,529 | 0.1% |
| 2014 | 49,455 | 0.1% |
| 2013 | 49,398 | 0.8% |
| 2012 | 49,027 | -0.2% |
| 2011 | 49,119 | -0.3% |
| 2010 | 49,272 | - |
Race / Ethnicity in Monroe
See the full breakdown
Monroe is:
34.1% White with 16,038 White residents.
59.8% African American with 28,085 African American residents.
0.1% American Indian with 38 American Indian residents.
1.9% Asian with 903 Asian residents.
0.0% Hawaiian with 4 Hawaiian residents.
0.2% Other with 82 Other residents.
1.2% Two Or More with 569 Two Or More residents.
2.7% Hispanic with 1,285 Hispanic residents.
| Race | Monroe | LA | USA |
|---|---|---|---|
| White | 34.1% | 55.7% | 57.4% |
| African American | 59.8% | 30.5% | 11.9% |
| American Indian | 0.1% | 0.4% | 0.5% |
| Asian | 1.9% | 1.7% | 5.9% |
| Hawaiian | 0.0% | 0.1% | 0.2% |
| Other | 0.2% | 0.5% | 0.6% |
| Two Or More | 1.2% | 3.8% | 4.3% |
| Hispanic | 2.7% | 7.2% | 19.3% |
Gender in Monroe
See the full breakdown
Monroe is 53.5% female with 25,155 female residents.
Monroe is 46.5% male with 21,848 male residents.
| Gender | Monroe | LA | USA |
|---|---|---|---|
| Female | 53.5% | 51.1% | 50.5% |
| Male | 46.5% | 48.9% | 49.5% |
Highest level of educational attainment in Monroe for adults over 25
See the full breakdown
2.0% of adults in Monroe completed < 9th grade.
11.0% of adults in Monroe completed 9-12th grade.
28.0% of adults in Monroe completed high school / ged.
21.0% of adults in Monroe completed some college.
5.0% of adults in Monroe completed associate's degree.
18.0% of adults in Monroe completed bachelor's degree.
9.0% of adults in Monroe completed master's degree.
4.0% of adults in Monroe completed professional degree.
2.0% of adults in Monroe completed doctorate degree.
| Education | Monroe | LA | USA |
|---|---|---|---|
| < 9th Grade | 2.0% | 6.0% | 4.0% |
| 9-12th Grade | 11.0% | 8.0% | 6.0% |
| High School / GED | 28.0% | 32.0% | 26.0% |
| Some College | 21.0% | 20.0% | 19.0% |
| Associate's Degree | 5.0% | 7.0% | 9.0% |
| Bachelor's Degree | 18.0% | 17.0% | 22.0% |
| Master's Degree | 9.0% | 7.0% | 10.0% |
| Professional Degree | 4.0% | 2.0% | 2.0% |
| Doctorate Degree | 2.0% | 1.0% | 2.0% |
Household Income For Monroe, Louisiana
See the full breakdown
15.1% of households in Monroe earn Less than $10,000.
11.3% of households in Monroe earn $10,000 to $14,999.
12.1% of households in Monroe earn $15,000 to $24,999.
7.3% of households in Monroe earn $25,000 to $34,999.
12.3% of households in Monroe earn $35,000 to $49,999.
13.6% of households in Monroe earn $50,000 to $74,999.
8.4% of households in Monroe earn $75,000 to $99,999.
7.2% of households in Monroe earn $100,000 to $149,999.
4.4% of households in Monroe earn $150,000 to $199,999.
8.1% of households in Monroe earn $200,000 or more.
| Income | Monroe | LA | USA |
|---|---|---|---|
| Less than $10,000 | 15.1% | 7.2% | 5.0% |
| $10,000 to $14,999 | 11.3% | 5.8% | 3.4% |
| $15,000 to $24,999 | 12.1% | 9.4% | 6.3% |
| $25,000 to $34,999 | 7.3% | 8.4% | 6.6% |
| $35,000 to $49,999 | 12.3% | 11.8% | 10.1% |
| $50,000 to $74,999 | 13.6% | 15.9% | 15.5% |
| $75,000 to $99,999 | 8.4% | 11.7% | 12.6% |
| $100,000 to $149,999 | 7.2% | 14.8% | 17.5% |
| $150,000 to $199,999 | 4.4% | 7.3% | 9.6% |
| $200,000 or more | 8.1% | 7.8% | 13.4% |
Source: U.S. Census ACS 5-year estimates (2024)


