Compare Shreveport to…
Shreveport SnackAbility
Overall SnackAbility
Crime in Shreveport summary. We use data from the FBI to determine the crime rates in Shreveport. Key points include:
There were 9,138 total crimes in Shreveport in the last reporting year.
The overall crime rate per 100,000 people in Shreveport is 5,219.0 / 100k people.
The violent crime rate per 100,000 people in Shreveport is 1,228.5 / 100k people.
The property crime rate per 100,000 people in Shreveport is 3,990.5 / 100k people.
Overall, crime in Shreveport is 146.27% above the national average.
Total Crimes
Above National Average
Crime In Shreveport Comparison Table
| Statistic | Count Raw |
Shreveport / 100k People |
Louisiana / 100k People |
National / 100k People |
|---|---|---|---|---|
| Total Crimes Per 100K | 9,138 | 5,219.0 | 2,816.2 | 2,119.2 |
| Violent Crime | 2,151 | 1,228.5 | 519.8 | 359.0 |
| Murder | 47 | 26.8 | 10.8 | 5.0 |
| Robbery | 140 | 80.0 | 39.4 | 61.0 |
| Aggravated Assault | 1,818 | 1,038.3 | 436.0 | 256.0 |
| Property Crime | 6,987 | 3,990.5 | 2,296.4 | 1,760.0 |
| Burglary | 1,368 | 781.3 | 405.4 | 229.0 |
| Larceny | 4,603 | 2,628.9 | 1,636.2 | 1,272.0 |
| Car Theft | 1,016 | 580.3 | 254.8 | 259.0 |
Source: FBI Uniform Crime Reporting (2024)
Cost of living in Shreveport summary. We use data on the cost of living to determine how expensive it is to live in Shreveport. Real estate prices drive most of the variance in cost of living around Louisiana. Key points include:
The cost of living in Shreveport is 94 with 100 being average.
The cost of living in Shreveport is 0.9x lower than the national average.
The median home value in Shreveport is $135,091.
The median income in Shreveport is $48,699.
Shreveport's Overall Cost Of Living
Lower Than The National Average
Cost Of Living In Shreveport Comparison Table
| Living Expense | Shreveport | Louisiana | National Average |
|---|---|---|---|
| Overall | 94 | 91 | 100 |
| Services | 99 | 97 | 100 |
| Groceries | 100 | 97 | 100 |
| Health | 83 | 82 | 100 |
| Housing | 100 | 97 | 100 |
| Transportation | 103 | 99 | 100 |
| Utilities | 99 | 96 | 100 |
Source: Cost of living index, normalized to US average = 100
Shreveport, LA Weather
The average high in Shreveport is 75.9° and the average low is 54.2°.
There are 65.4 days of precipitation each year.
Expect an average of 51.6 inches of precipitation each year with 0.7 inches of snow.
| Stat | Shreveport |
|---|---|
| Average Annual High | 75.9 |
| Average Annual Low | 54.2 |
| Annual Precipitation Days | 65.4 |
| Average Annual Precipitation | 51.6 |
| Average Annual Snowfall | 0.7 |
Average High
Days of Rain
Source: NOAA climate normals (30-year)
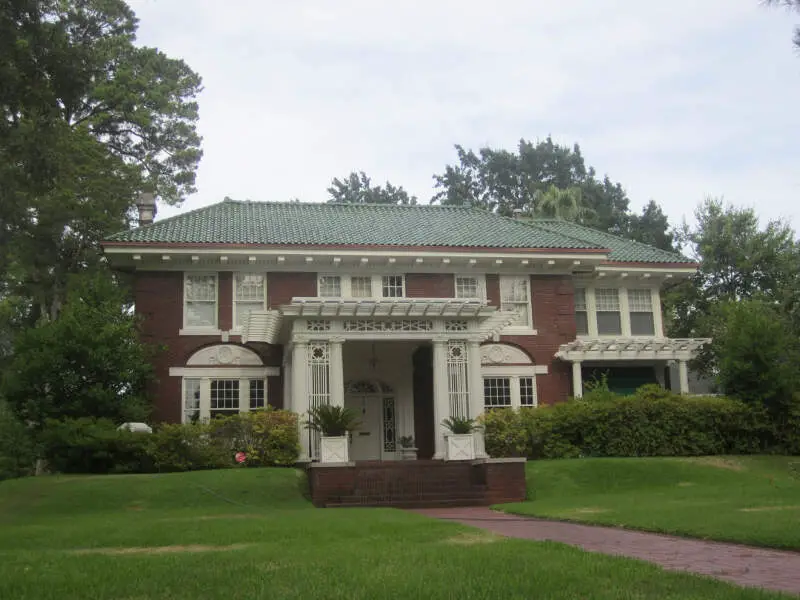
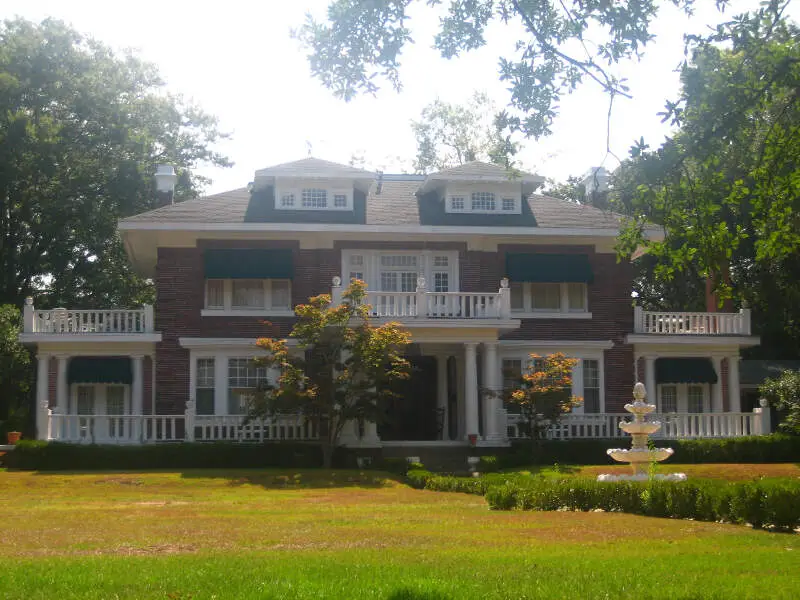
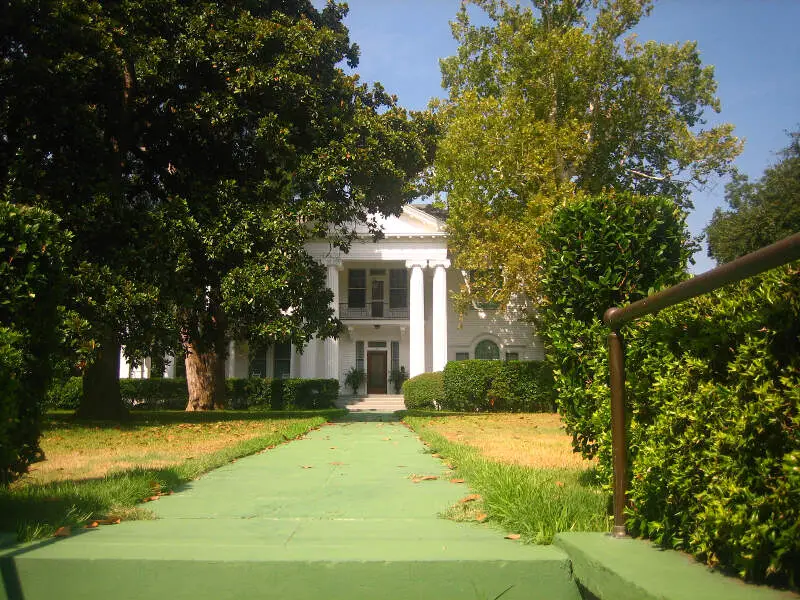
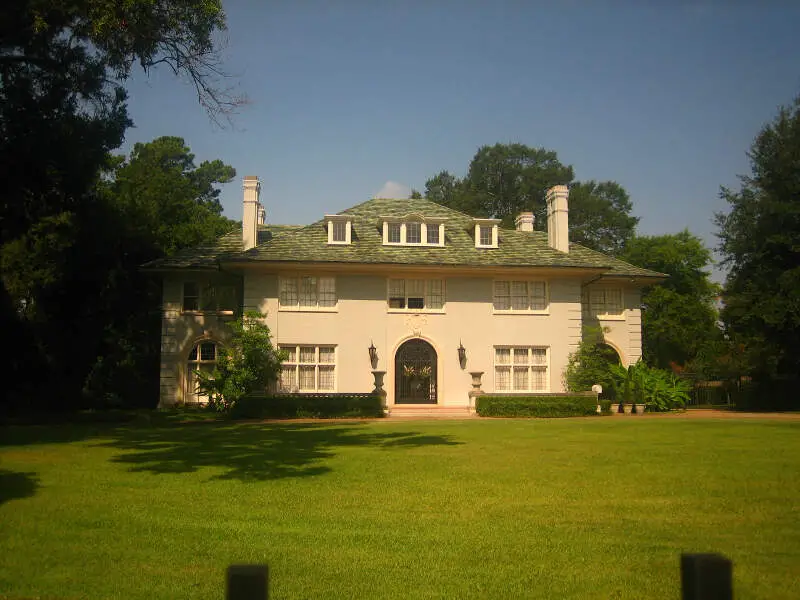
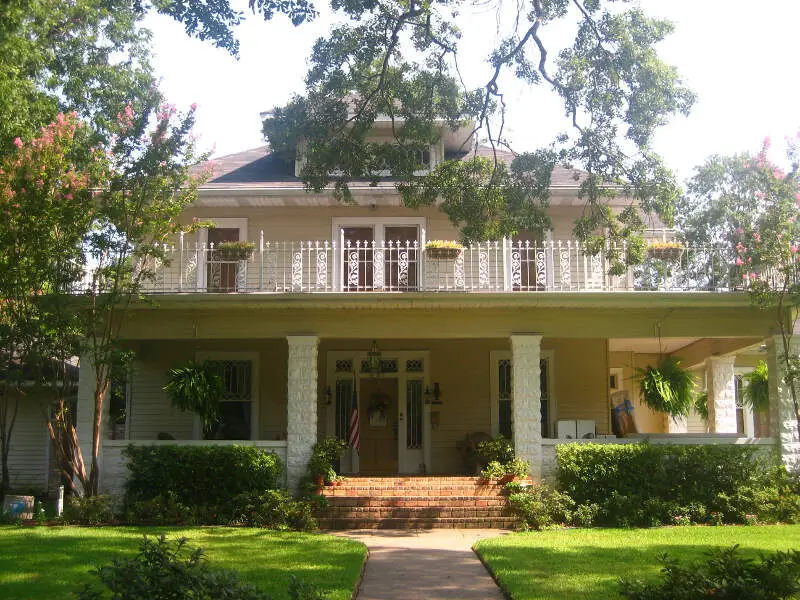
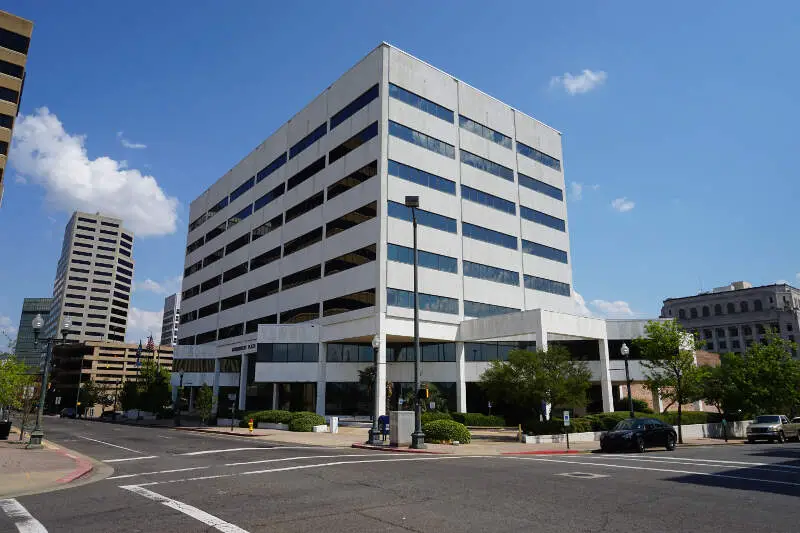
Shreveport, LA Photos


1 Reviews & Comments About Shreveport

I live in Shreveport,Louisiana. The past few years Shreveport has attained the nickname, The Ratchet City. I'm sorry to say that ratchet pretty much says it all. But I love Louisiana. It's really a great state. The people here are down to earth good folks. They will welcome a stranger and feed you the best food you've ever had! It's hard to find better food anywhere than Louisiana. If you love jazz, like I do, New Orleans is the place to be. But yes, Shreveport is not the city I grew up in. I've been here 61 years and it is sad to see how things have changed. It's really strange how even through the ugliness the hearts of the people are still filled with love.
Rankings & Articles For Shreveport


Locations Around Shreveport
Map Of Shreveport, LA
Best Places Around Shreveport
Minden, LA
Population 11,455
Springhill, LA
Population 4,599
Red Chute, LA
Population 6,526
Marshall, TX
Population 23,825
Mansfield, LA
Population 4,619
Jamestown, ND
Population 15,787
Shreveport Demographics And Statistics
Population over time in Shreveport
The current population in Shreveport is 180,982. The population has decreased 8.8% from 2010.
| Year | Population | % Change |
|---|---|---|
| 2024 | 180,982 | -1.4% |
| 2023 | 183,483 | -1.5% |
| 2022 | 186,183 | -1.7% |
| 2021 | 189,374 | -0.3% |
| 2020 | 189,890 | -1.1% |
| 2019 | 192,035 | -0.9% |
| 2018 | 193,785 | -1.2% |
| 2017 | 196,217 | -1.2% |
| 2016 | 198,571 | -0.7% |
| 2015 | 200,015 | -0.3% |
| 2014 | 200,692 | -0.0% |
| 2013 | 200,715 | 0.3% |
| 2012 | 200,099 | 0.6% |
| 2011 | 198,886 | 0.2% |
| 2010 | 198,477 | - |
Race / Ethnicity in Shreveport
See the full breakdown
Shreveport is:
34.9% White with 63,094 White residents.
55.9% African American with 101,251 African American residents.
0.1% American Indian with 247 American Indian residents.
1.6% Asian with 2,807 Asian residents.
0.0% Hawaiian with 89 Hawaiian residents.
0.3% Other with 461 Other residents.
3.1% Two Or More with 5,677 Two Or More residents.
4.1% Hispanic with 7,356 Hispanic residents.
| Race | Shreveport | LA | USA |
|---|---|---|---|
| White | 34.9% | 55.7% | 57.4% |
| African American | 55.9% | 30.5% | 11.9% |
| American Indian | 0.1% | 0.4% | 0.5% |
| Asian | 1.6% | 1.7% | 5.9% |
| Hawaiian | 0.0% | 0.1% | 0.2% |
| Other | 0.3% | 0.5% | 0.6% |
| Two Or More | 3.1% | 3.8% | 4.3% |
| Hispanic | 4.1% | 7.2% | 19.3% |
Gender in Shreveport
See the full breakdown
Shreveport is 53.1% female with 96,035 female residents.
Shreveport is 46.9% male with 84,947 male residents.
| Gender | Shreveport | LA | USA |
|---|---|---|---|
| Female | 53.1% | 51.1% | 50.5% |
| Male | 46.9% | 48.9% | 49.5% |
Highest level of educational attainment in Shreveport for adults over 25
See the full breakdown
3.0% of adults in Shreveport completed < 9th grade.
9.0% of adults in Shreveport completed 9-12th grade.
30.0% of adults in Shreveport completed high school / ged.
23.0% of adults in Shreveport completed some college.
7.0% of adults in Shreveport completed associate's degree.
16.0% of adults in Shreveport completed bachelor's degree.
8.0% of adults in Shreveport completed master's degree.
3.0% of adults in Shreveport completed professional degree.
1.0% of adults in Shreveport completed doctorate degree.
| Education | Shreveport | LA | USA |
|---|---|---|---|
| < 9th Grade | 3.0% | 6.0% | 4.0% |
| 9-12th Grade | 9.0% | 8.0% | 6.0% |
| High School / GED | 30.0% | 32.0% | 26.0% |
| Some College | 23.0% | 20.0% | 19.0% |
| Associate's Degree | 7.0% | 7.0% | 9.0% |
| Bachelor's Degree | 16.0% | 17.0% | 22.0% |
| Master's Degree | 8.0% | 7.0% | 10.0% |
| Professional Degree | 3.0% | 2.0% | 2.0% |
| Doctorate Degree | 1.0% | 1.0% | 2.0% |
Household Income For Shreveport, Louisiana
See the full breakdown
8.4% of households in Shreveport earn Less than $10,000.
7.5% of households in Shreveport earn $10,000 to $14,999.
13.0% of households in Shreveport earn $15,000 to $24,999.
9.0% of households in Shreveport earn $25,000 to $34,999.
13.3% of households in Shreveport earn $35,000 to $49,999.
15.9% of households in Shreveport earn $50,000 to $74,999.
10.3% of households in Shreveport earn $75,000 to $99,999.
11.4% of households in Shreveport earn $100,000 to $149,999.
4.7% of households in Shreveport earn $150,000 to $199,999.
6.4% of households in Shreveport earn $200,000 or more.
| Income | Shreveport | LA | USA |
|---|---|---|---|
| Less than $10,000 | 8.4% | 7.2% | 5.0% |
| $10,000 to $14,999 | 7.5% | 5.8% | 3.4% |
| $15,000 to $24,999 | 13.0% | 9.4% | 6.3% |
| $25,000 to $34,999 | 9.0% | 8.4% | 6.6% |
| $35,000 to $49,999 | 13.3% | 11.8% | 10.1% |
| $50,000 to $74,999 | 15.9% | 15.9% | 15.5% |
| $75,000 to $99,999 | 10.3% | 11.7% | 12.6% |
| $100,000 to $149,999 | 11.4% | 14.8% | 17.5% |
| $150,000 to $199,999 | 4.7% | 7.3% | 9.6% |
| $200,000 or more | 6.4% | 7.8% | 13.4% |
Source: U.S. Census ACS 5-year estimates (2024)


