St. Martinville SnackAbility
Overall SnackAbility
Cost of living in St. Martinville summary. We use data on the cost of living to determine how expensive it is to live in St. Martinville. Real estate prices drive most of the variance in cost of living around Louisiana. Key points include:
The cost of living in St. Martinville is 89 with 100 being average.
The cost of living in St. Martinville is 0.9x lower than the national average.
The median home value in St. Martinville is $150,321.
The median income in St. Martinville is $36,130.
St. Martinville's Overall Cost Of Living
Lower Than The National Average
Cost Of Living In St. Martinville Comparison Table
| Living Expense | St. Martinville | Louisiana | National Average |
|---|---|---|---|
| Overall | 89 | 91 | 100 |
| Services | 97 | 97 | 100 |
| Groceries | 95 | 97 | 100 |
| Health | 65 | 82 | 100 |
| Housing | 101 | 97 | 100 |
| Transportation | 101 | 99 | 100 |
| Utilities | 94 | 96 | 100 |
Source: Cost of living index, normalized to US average = 100
St. Martinville, LA Weather
The average high in St. Martinville is 77.7° and the average low is 57.9°.
There are 77.2 days of precipitation each year.
Expect an average of 62.2 inches of precipitation each year with 0.0 inches of snow.
| Stat | St. Martinville |
|---|---|
| Average Annual High | 77.7 |
| Average Annual Low | 57.9 |
| Annual Precipitation Days | 77.2 |
| Average Annual Precipitation | 62.2 |
| Average Annual Snowfall | 0.0 |
Average High
Days of Rain
Source: NOAA climate normals (30-year)
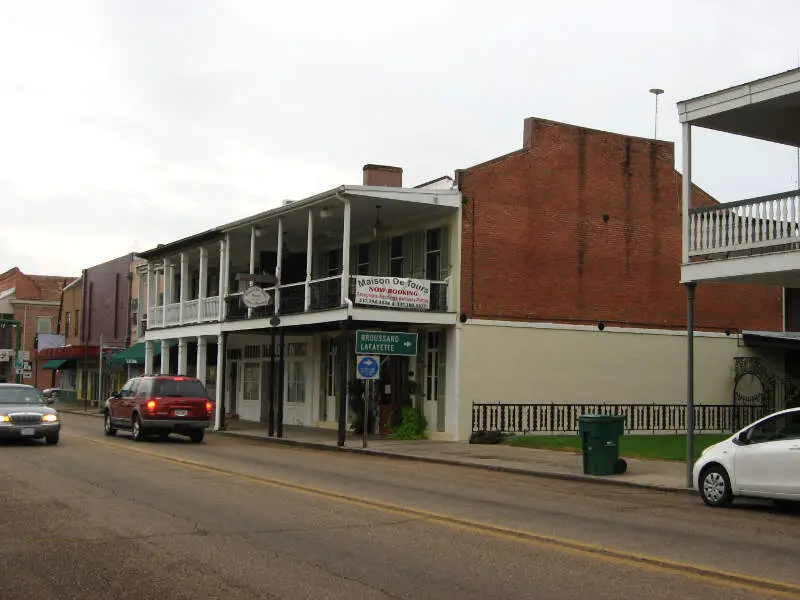
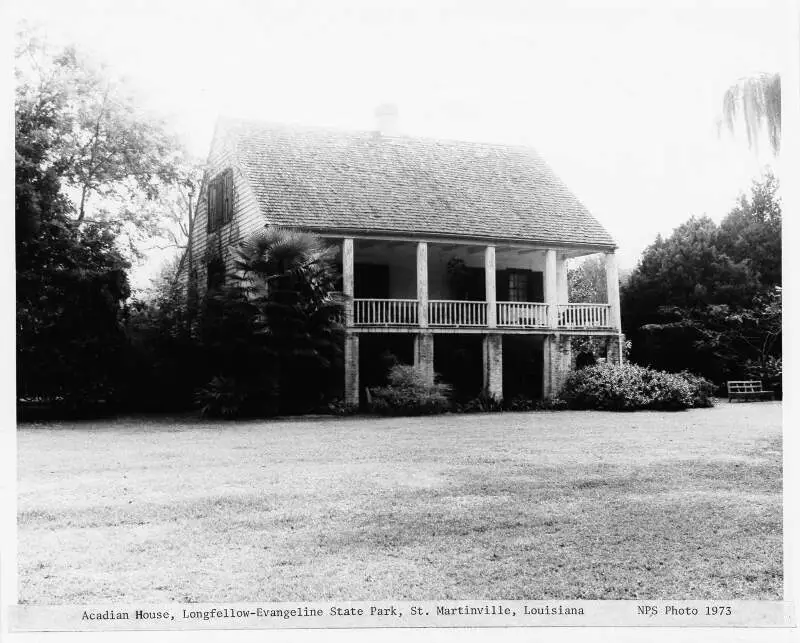
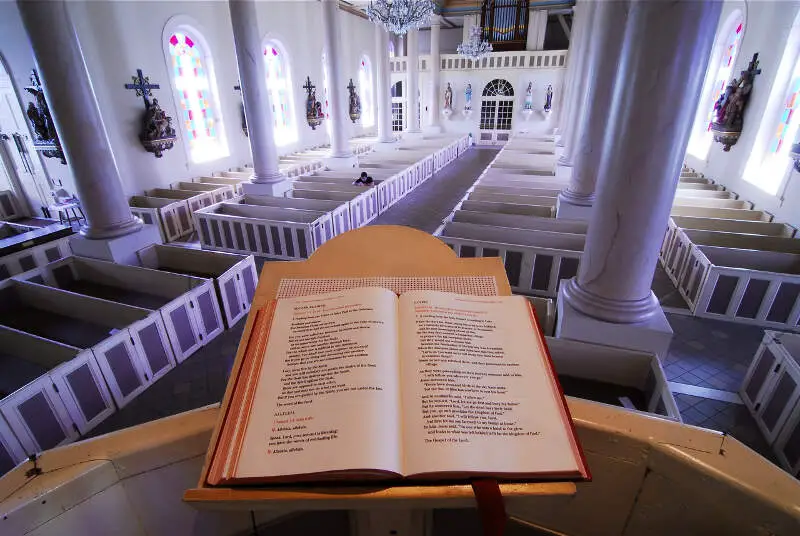
St. Martinville, LA Photos

Rankings & Articles For St. Martinville


Locations Around St. Martinville
Map Of St. Martinville, LA
Best Places Around St. Martinville
New Iberia, LA
Population 27,571
Lafayette, LA
Population 121,715
Breaux Bridge, LA
Population 7,501
Jeanerette, LA
Population 4,655
Scott, LA
Population 8,609
Youngsville, LA
Population 17,427
Carencro, LA
Population 11,619
Broussard, LA
Population 14,322
St. Martinville Demographics And Statistics
Population over time in St. Martinville
The current population in St. Martinville is 5,297. The population has decreased 15.8% from 2010.
| Year | Population | % Change |
|---|---|---|
| 2024 | 5,297 | -1.3% |
| 2023 | 5,367 | -1.5% |
| 2022 | 5,447 | -2.8% |
| 2021 | 5,602 | -4.1% |
| 2020 | 5,844 | -1.7% |
| 2019 | 5,945 | -1.1% |
| 2018 | 6,014 | -0.7% |
| 2017 | 6,058 | -0.6% |
| 2016 | 6,096 | -0.1% |
| 2015 | 6,105 | -0.1% |
| 2014 | 6,109 | -0.3% |
| 2013 | 6,128 | -0.6% |
| 2012 | 6,165 | -1.2% |
| 2011 | 6,237 | -0.9% |
| 2010 | 6,294 | - |
Race / Ethnicity in St. Martinville
See the full breakdown
St. Martinville is:
45.2% White with 2,396 White residents.
48.9% African American with 2,588 African American residents.
0.0% American Indian with 0 American Indian residents.
0.4% Asian with 22 Asian residents.
0.0% Hawaiian with 0 Hawaiian residents.
1.1% Other with 59 Other residents.
2.9% Two Or More with 155 Two Or More residents.
1.5% Hispanic with 77 Hispanic residents.
| Race | St. Martinville | LA | USA |
|---|---|---|---|
| White | 45.2% | 55.7% | 57.4% |
| African American | 48.9% | 30.5% | 11.9% |
| American Indian | 0.0% | 0.4% | 0.5% |
| Asian | 0.4% | 1.7% | 5.9% |
| Hawaiian | 0.0% | 0.1% | 0.2% |
| Other | 1.1% | 0.5% | 0.6% |
| Two Or More | 2.9% | 3.8% | 4.3% |
| Hispanic | 1.5% | 7.2% | 19.3% |
Gender in St. Martinville
See the full breakdown
St. Martinville is 54.6% female with 2,892 female residents.
St. Martinville is 45.4% male with 2,405 male residents.
| Gender | St. Martinville | LA | USA |
|---|---|---|---|
| Female | 54.6% | 51.1% | 50.5% |
| Male | 45.4% | 48.9% | 49.5% |
Highest level of educational attainment in St. Martinville for adults over 25
See the full breakdown
8.0% of adults in St. Martinville completed < 9th grade.
14.0% of adults in St. Martinville completed 9-12th grade.
43.0% of adults in St. Martinville completed high school / ged.
13.0% of adults in St. Martinville completed some college.
5.0% of adults in St. Martinville completed associate's degree.
11.0% of adults in St. Martinville completed bachelor's degree.
4.0% of adults in St. Martinville completed master's degree.
2.0% of adults in St. Martinville completed professional degree.
0.0% of adults in St. Martinville completed doctorate degree.
| Education | St. Martinville | LA | USA |
|---|---|---|---|
| < 9th Grade | 8.0% | 6.0% | 4.0% |
| 9-12th Grade | 14.0% | 8.0% | 6.0% |
| High School / GED | 43.0% | 32.0% | 26.0% |
| Some College | 13.0% | 20.0% | 19.0% |
| Associate's Degree | 5.0% | 7.0% | 9.0% |
| Bachelor's Degree | 11.0% | 17.0% | 22.0% |
| Master's Degree | 4.0% | 7.0% | 10.0% |
| Professional Degree | 2.0% | 2.0% | 2.0% |
| Doctorate Degree | 0.0% | 1.0% | 2.0% |
Household Income For St. Martinville, Louisiana
See the full breakdown
9.1% of households in St. Martinville earn Less than $10,000.
12.3% of households in St. Martinville earn $10,000 to $14,999.
13.2% of households in St. Martinville earn $15,000 to $24,999.
11.7% of households in St. Martinville earn $25,000 to $34,999.
16.6% of households in St. Martinville earn $35,000 to $49,999.
8.8% of households in St. Martinville earn $50,000 to $74,999.
15.2% of households in St. Martinville earn $75,000 to $99,999.
11.9% of households in St. Martinville earn $100,000 to $149,999.
0.4% of households in St. Martinville earn $150,000 to $199,999.
0.7% of households in St. Martinville earn $200,000 or more.
| Income | St. Martinville | LA | USA |
|---|---|---|---|
| Less than $10,000 | 9.1% | 7.2% | 5.0% |
| $10,000 to $14,999 | 12.3% | 5.8% | 3.4% |
| $15,000 to $24,999 | 13.2% | 9.4% | 6.3% |
| $25,000 to $34,999 | 11.7% | 8.4% | 6.6% |
| $35,000 to $49,999 | 16.6% | 11.8% | 10.1% |
| $50,000 to $74,999 | 8.8% | 15.9% | 15.5% |
| $75,000 to $99,999 | 15.2% | 11.7% | 12.6% |
| $100,000 to $149,999 | 11.9% | 14.8% | 17.5% |
| $150,000 to $199,999 | 0.4% | 7.3% | 9.6% |
| $200,000 or more | 0.7% | 7.8% | 13.4% |
Source: U.S. Census ACS 5-year estimates (2024)


