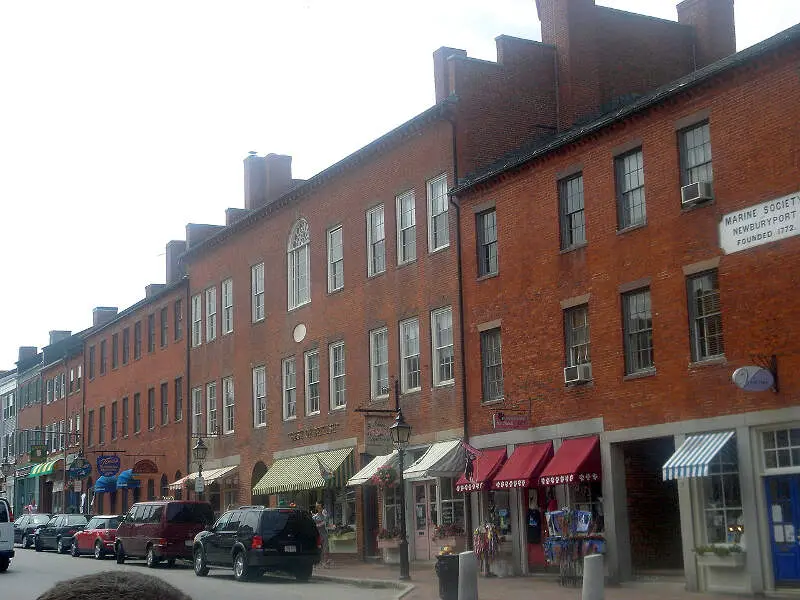
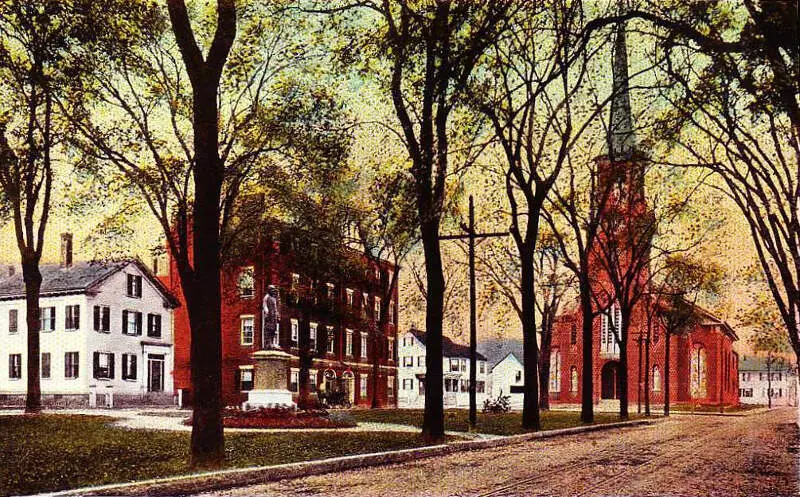
Newburyport, MA
Demographics And Statistics
Living In Newburyport, Massachusetts Summary
Life in Newburyport research summary. HomeSnacks has been using Saturday Night Science to research the quality of life in Newburyport over the past nine years using Census, FBI, Zillow, and other primary data sources. Based on the most recently available data, we found the following about life in Newburyport:
The population in Newburyport is 18,444.
The median home value in Newburyport is $916,555.
The median income in Newburyport is $144,259.
The cost of living in Newburyport is 161 which is 1.6x higher than the national average.
The median rent in Newburyport is $1,511.
The unemployment rate in Newburyport is 5.8%.
The poverty rate in Newburyport is 5.1%.
The average high in Newburyport is 58.1° and the average low is 38.5°.
Newburyport SnackAbility
Overall SnackAbility
Newburyport, MA Crime Report
Crime in Newburyport summary. We use data from the FBI to determine the crime rates in Newburyport. Key points include:
There were 85 total crimes in Newburyport in the last reporting year.
The overall crime rate per 100,000 people in Newburyport is 442.0 / 100k people.
The violent crime rate per 100,000 people in Newburyport is 46.8 / 100k people.
The property crime rate per 100,000 people in Newburyport is 395.2 / 100k people.
Overall, crime in Newburyport is -79.14% below the national average.
Total Crimes
Below National Average
Crime In Newburyport Comparison Table
| Statistic | Count Raw |
Newburyport / 100k People |
Massachusetts / 100k People |
National / 100k People |
|---|---|---|---|---|
| Total Crimes Per 100K | 85 | 442.0 | 1,426.8 | 2,119.2 |
| Violent Crime | 9 | 46.8 | 314.7 | 359.0 |
| Murder | 0 | 0.0 | 1.8 | 5.0 |
| Robbery | 0 | 0.0 | 36.0 | 61.0 |
| Aggravated Assault | 5 | 26.0 | 249.3 | 256.0 |
| Property Crime | 76 | 395.2 | 1,112.1 | 1,760.0 |
| Burglary | 4 | 20.8 | 130.3 | 229.0 |
| Larceny | 67 | 348.4 | 876.3 | 1,272.0 |
| Car Theft | 5 | 26.0 | 105.5 | 259.0 |
Newburyport, MA Cost Of Living
Cost of living in Newburyport summary. We use data on the cost of living to determine how expensive it is to live in Newburyport. Real estate prices drive most of the variance in cost of living around Massachusetts. Key points include:
The cost of living in Newburyport is 161 with 100 being average.
The cost of living in Newburyport is 1.6x higher than the national average.
The median home value in Newburyport is $916,555.
The median income in Newburyport is $144,259.
Newburyport's Overall Cost Of Living
Higher Than The National Average
Cost Of Living In Newburyport Comparison Table
| Living Expense | Newburyport | Massachusetts | National Average | |
|---|---|---|---|---|
| Overall | 161 | 134 | 100 | |
| Services | 121 | 121 | 100 | |
| Groceries | 104 | 106 | 100 | |
| Health | 115 | 112 | 100 | |
| Housing | 273 | 164 | 100 | |
| Transportation | 111 | 120 | 100 | |
| Utilities | 130 | 136 | 100 | |
Newburyport, MA Weather
The average high in Newburyport is 58.1° and the average low is 38.5°.
There are 84.4 days of precipitation each year.
Expect an average of 49.2 inches of precipitation each year with 54.5 inches of snow.
| Stat | Newburyport |
|---|---|
| Average Annual High | 58.1 |
| Average Annual Low | 38.5 |
| Annual Precipitation Days | 84.4 |
| Average Annual Precipitation | 49.2 |
| Average Annual Snowfall | 54.5 |
Average High
Days of Rain
Newburyport, MA Photos


Rankings for Newburyport in Massachusetts


Locations Around Newburyport
Map Of Newburyport, MA
Best Places Around Newburyport
Andover, MA
Population 9,261
Danvers, MA
Population 27,924
Beverly, MA
Population 42,408
Peabody, MA
Population 54,180
Gloucester, MA
Population 29,862
Newmarket, NH
Population 5,730
Exeter, NH
Population 10,138
Portsmouth, NH
Population 22,332
Haverhill, MA
Population 67,387
Newburyport Demographics And Statistics
Population over time in Newburyport
The current population in Newburyport is 18,444. The population has increased 6.7% from 2010.
| Year | Population | % Change |
|---|---|---|
| 2023 | 18,444 | 0.5% |
| 2022 | 18,356 | 0.4% |
| 2021 | 18,282 | 0.5% |
| 2020 | 18,197 | 0.7% |
| 2019 | 18,077 | 0.5% |
| 2018 | 17,990 | 0.6% |
| 2017 | 17,890 | 0.3% |
| 2016 | 17,837 | 0.4% |
| 2015 | 17,766 | 0.6% |
| 2014 | 17,662 | 0.5% |
| 2013 | 17,569 | 0.6% |
| 2012 | 17,460 | 0.5% |
| 2011 | 17,370 | 0.5% |
| 2010 | 17,288 | - |
Race / Ethnicity in Newburyport
Newburyport is:
91.0% White with 16,780 White residents.
0.4% African American with 73 African American residents.
0.0% American Indian with 0 American Indian residents.
0.7% Asian with 129 Asian residents.
0.0% Hawaiian with 0 Hawaiian residents.
0.1% Other with 23 Other residents.
3.8% Two Or More with 699 Two Or More residents.
4.0% Hispanic with 740 Hispanic residents.
| Race | Newburyport | MA | USA |
|---|---|---|---|
| White | 91.0% | 67.8% | 58.2% |
| African American | 0.4% | 6.5% | 12.0% |
| American Indian | 0.0% | 0.1% | 0.5% |
| Asian | 0.7% | 7.0% | 5.7% |
| Hawaiian | 0.0% | 0.0% | 0.2% |
| Other | 0.1% | 1.1% | 0.5% |
| Two Or More | 3.8% | 4.5% | 3.9% |
| Hispanic | 4.0% | 12.9% | 19.0% |
Gender in Newburyport
Newburyport is 55.7% female with 10,266 female residents.
Newburyport is 44.3% male with 8,178 male residents.
| Gender | Newburyport | MA | USA |
|---|---|---|---|
| Female | 55.7% | 51.1% | 50.5% |
| Male | 44.3% | 48.9% | 49.5% |
Highest level of educational attainment in Newburyport for adults over 25
2.0% of adults in Newburyport completed < 9th grade.
2.0% of adults in Newburyport completed 9-12th grade.
12.0% of adults in Newburyport completed high school / ged.
13.0% of adults in Newburyport completed some college.
6.0% of adults in Newburyport completed associate's degree.
37.0% of adults in Newburyport completed bachelor's degree.
21.0% of adults in Newburyport completed master's degree.
4.0% of adults in Newburyport completed professional degree.
3.0% of adults in Newburyport completed doctorate degree.
| Education | Newburyport | MA | USA |
|---|---|---|---|
| < 9th Grade | 2.0% | 5.0% | 5.0% |
| 9-12th Grade | 2.0% | 4.0% | 6.0% |
| High School / GED | 12.0% | 23.0% | 26.0% |
| Some College | 13.0% | 14.0% | 19.0% |
| Associate's Degree | 6.0% | 8.0% | 9.0% |
| Bachelor's Degree | 37.0% | 25.0% | 21.0% |
| Master's Degree | 21.0% | 15.0% | 10.0% |
| Professional Degree | 4.0% | 3.0% | 2.0% |
| Doctorate Degree | 3.0% | 3.0% | 2.0% |
Household Income For Newburyport, Massachusetts
2.6% of households in Newburyport earn Less than $10,000.
1.8% of households in Newburyport earn $10,000 to $14,999.
4.7% of households in Newburyport earn $15,000 to $24,999.
5.3% of households in Newburyport earn $25,000 to $34,999.
7.2% of households in Newburyport earn $35,000 to $49,999.
7.5% of households in Newburyport earn $50,000 to $74,999.
10.0% of households in Newburyport earn $75,000 to $99,999.
13.3% of households in Newburyport earn $100,000 to $149,999.
14.0% of households in Newburyport earn $150,000 to $199,999.
33.5% of households in Newburyport earn $200,000 or more.
| Income | Newburyport | MA | USA |
|---|---|---|---|
| Less than $10,000 | 2.6% | 4.3% | 4.9% |
| $10,000 to $14,999 | 1.8% | 3.5% | 3.6% |
| $15,000 to $24,999 | 4.7% | 5.6% | 6.6% |
| $25,000 to $34,999 | 5.3% | 5.1% | 6.8% |
| $35,000 to $49,999 | 7.2% | 7.7% | 10.4% |
| $50,000 to $74,999 | 7.5% | 12.2% | 15.7% |
| $75,000 to $99,999 | 10.0% | 11.0% | 12.7% |
| $100,000 to $149,999 | 13.3% | 17.7% | 17.4% |
| $150,000 to $199,999 | 14.0% | 11.8% | 9.3% |
| $200,000 or more | 33.5% | 21.1% | 12.6% |


