Taunton SnackAbility
Overall SnackAbility
Crime in Taunton summary. We use data from the FBI to determine the crime rates in Taunton. Key points include:
There were 793 total crimes in Taunton in the last reporting year.
The overall crime rate per 100,000 people in Taunton is 1,281.6 / 100k people.
The violent crime rate per 100,000 people in Taunton is 447.7 / 100k people.
The property crime rate per 100,000 people in Taunton is 834.0 / 100k people.
Overall, crime in Taunton is -39.52% below the national average.
Total Crimes
Below National Average
Crime In Taunton Comparison Table
| Statistic | Count Raw |
Taunton / 100k People |
Massachusetts / 100k People |
National / 100k People |
|---|---|---|---|---|
| Total Crimes Per 100K | 793 | 1,281.6 | 1,426.8 | 2,119.2 |
| Violent Crime | 277 | 447.7 | 314.7 | 359.0 |
| Murder | 1 | 1.6 | 1.8 | 5.0 |
| Robbery | 17 | 27.5 | 36.0 | 61.0 |
| Aggravated Assault | 247 | 399.2 | 249.3 | 256.0 |
| Property Crime | 516 | 834.0 | 1,112.1 | 1,760.0 |
| Burglary | 72 | 116.4 | 130.3 | 229.0 |
| Larceny | 391 | 631.9 | 876.3 | 1,272.0 |
| Car Theft | 53 | 85.7 | 105.5 | 259.0 |
Source: FBI Uniform Crime Reporting (2024)
Cost of living in Taunton summary. We use data on the cost of living to determine how expensive it is to live in Taunton. Real estate prices drive most of the variance in cost of living around Massachusetts. Key points include:
The cost of living in Taunton is 124 with 100 being average.
The cost of living in Taunton is 1.2x higher than the national average.
The median home value in Taunton is $513,321.
The median income in Taunton is $79,283.
Taunton's Overall Cost Of Living
Higher Than The National Average
Cost Of Living In Taunton Comparison Table
| Living Expense | Taunton | Massachusetts | National Average |
|---|---|---|---|
| Overall | 124 | 130 | 100 |
| Services | 109 | 110 | 100 |
| Groceries | 117 | 115 | 100 |
| Health | 146 | 168 | 100 |
| Housing | 115 | 117 | 100 |
| Transportation | 118 | 115 | 100 |
| Utilities | 109 | 114 | 100 |
Source: Cost of living index, normalized to US average = 100
Taunton, MA Weather
The average high in Taunton is 60.3° and the average low is 40.1°.
There are 78.7 days of precipitation each year.
Expect an average of 49.4 inches of precipitation each year with 31.4 inches of snow.
| Stat | Taunton |
|---|---|
| Average Annual High | 60.3 |
| Average Annual Low | 40.1 |
| Annual Precipitation Days | 78.7 |
| Average Annual Precipitation | 49.4 |
| Average Annual Snowfall | 31.4 |
Average High
Days of Rain
Source: NOAA climate normals (30-year)
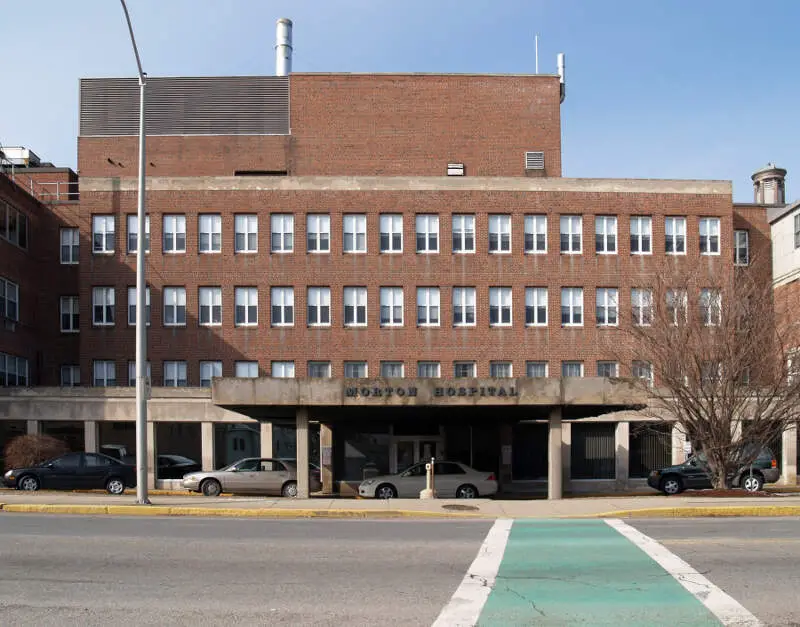
Taunton, MA Photos


Rankings & Articles For Taunton


Locations Around Taunton
Map Of Taunton, MA
Best Places Around Taunton
Sharon, MA
Population 6,232
Walpole, MA
Population 6,461
Foxborough, MA
Population 6,251
Southfield, MI
Population 76,236
Mansfield Center, MA
Population 7,222
Somerset, MA
Population 18,298
Abington, MA
Population 17,053
Central Falls, RI
Population 22,701
Taunton Demographics And Statistics
Population over time in Taunton
The current population in Taunton is 60,433. The population has increased 8.0% from 2010.
| Year | Population | % Change |
|---|---|---|
| 2024 | 60,433 | 1.2% |
| 2023 | 59,719 | 0.5% |
| 2022 | 59,436 | 0.6% |
| 2021 | 59,076 | 3.1% |
| 2020 | 57,327 | 0.4% |
| 2019 | 57,124 | 0.3% |
| 2018 | 56,963 | 0.2% |
| 2017 | 56,826 | 0.6% |
| 2016 | 56,504 | 0.4% |
| 2015 | 56,276 | 0.4% |
| 2014 | 56,056 | 0.2% |
| 2013 | 55,953 | 0.0% |
| 2012 | 55,951 | 0.0% |
| 2011 | 55,930 | -0.0% |
| 2010 | 55,954 | - |
Race / Ethnicity in Taunton
See the full breakdown
Taunton is:
70.3% White with 42,472 White residents.
7.7% African American with 4,679 African American residents.
0.1% American Indian with 81 American Indian residents.
1.9% Asian with 1,141 Asian residents.
0.0% Hawaiian with 0 Hawaiian residents.
1.3% Other with 794 Other residents.
9.7% Two Or More with 5,845 Two Or More residents.
9.0% Hispanic with 5,421 Hispanic residents.
| Race | Taunton | MA | USA |
|---|---|---|---|
| White | 70.3% | 66.6% | 57.4% |
| African American | 7.7% | 6.4% | 11.9% |
| American Indian | 0.1% | 0.1% | 0.5% |
| Asian | 1.9% | 7.3% | 5.9% |
| Hawaiian | 0.0% | 0.0% | 0.2% |
| Other | 1.3% | 1.2% | 0.6% |
| Two Or More | 9.7% | 5.1% | 4.3% |
| Hispanic | 9.0% | 13.3% | 19.3% |
Gender in Taunton
See the full breakdown
Taunton is 52.0% female with 31,454 female residents.
Taunton is 48.0% male with 28,978 male residents.
| Gender | Taunton | MA | USA |
|---|---|---|---|
| Female | 52.0% | 51.1% | 50.5% |
| Male | 48.0% | 48.9% | 49.5% |
Highest level of educational attainment in Taunton for adults over 25
See the full breakdown
7.0% of adults in Taunton completed < 9th grade.
8.0% of adults in Taunton completed 9-12th grade.
35.0% of adults in Taunton completed high school / ged.
19.0% of adults in Taunton completed some college.
8.0% of adults in Taunton completed associate's degree.
16.0% of adults in Taunton completed bachelor's degree.
6.0% of adults in Taunton completed master's degree.
1.0% of adults in Taunton completed professional degree.
0.0% of adults in Taunton completed doctorate degree.
| Education | Taunton | MA | USA |
|---|---|---|---|
| < 9th Grade | 7.0% | 6.0% | 4.0% |
| 9-12th Grade | 8.0% | 4.0% | 6.0% |
| High School / GED | 35.0% | 23.0% | 26.0% |
| Some College | 19.0% | 14.0% | 19.0% |
| Associate's Degree | 8.0% | 7.0% | 9.0% |
| Bachelor's Degree | 16.0% | 25.0% | 22.0% |
| Master's Degree | 6.0% | 15.0% | 10.0% |
| Professional Degree | 1.0% | 3.0% | 2.0% |
| Doctorate Degree | 0.0% | 3.0% | 2.0% |
Household Income For Taunton, Massachusetts
See the full breakdown
4.3% of households in Taunton earn Less than $10,000.
2.8% of households in Taunton earn $10,000 to $14,999.
10.3% of households in Taunton earn $15,000 to $24,999.
6.6% of households in Taunton earn $25,000 to $34,999.
9.5% of households in Taunton earn $35,000 to $49,999.
15.2% of households in Taunton earn $50,000 to $74,999.
11.4% of households in Taunton earn $75,000 to $99,999.
17.9% of households in Taunton earn $100,000 to $149,999.
12.8% of households in Taunton earn $150,000 to $199,999.
9.2% of households in Taunton earn $200,000 or more.
| Income | Taunton | MA | USA |
|---|---|---|---|
| Less than $10,000 | 4.3% | 4.4% | 5.0% |
| $10,000 to $14,999 | 2.8% | 3.3% | 3.4% |
| $15,000 to $24,999 | 10.3% | 5.5% | 6.3% |
| $25,000 to $34,999 | 6.6% | 5.0% | 6.6% |
| $35,000 to $49,999 | 9.5% | 7.5% | 10.1% |
| $50,000 to $74,999 | 15.2% | 12.0% | 15.5% |
| $75,000 to $99,999 | 11.4% | 10.7% | 12.6% |
| $100,000 to $149,999 | 17.9% | 17.5% | 17.5% |
| $150,000 to $199,999 | 12.8% | 11.9% | 9.6% |
| $200,000 or more | 9.2% | 22.3% | 13.4% |
Source: U.S. Census ACS 5-year estimates (2024)


