Southfield SnackAbility
Overall SnackAbility
Crime in Southfield summary. We use data from the FBI to determine the crime rates in Southfield. Key points include:
There were 2,198 total crimes in Southfield in the last reporting year.
The overall crime rate per 100,000 people in Southfield is 2,913.0 / 100k people.
The violent crime rate per 100,000 people in Southfield is 493.0 / 100k people.
The property crime rate per 100,000 people in Southfield is 2,420.0 / 100k people.
Overall, crime in Southfield is 37.46% above the national average.
Total Crimes
Above National Average
Crime In Southfield Comparison Table
| Statistic | Count Raw |
Southfield / 100k People |
Michigan / 100k People |
National / 100k People |
|---|---|---|---|---|
| Total Crimes Per 100K | 2,198 | 2,913.0 | 1,813.2 | 2,119.2 |
| Violent Crime | 372 | 493.0 | 434.3 | 359.0 |
| Murder | 1 | 1.3 | 5.2 | 5.0 |
| Robbery | 30 | 39.8 | 31.3 | 61.0 |
| Aggravated Assault | 296 | 392.3 | 341.3 | 256.0 |
| Property Crime | 1,826 | 2,420.0 | 1,378.9 | 1,760.0 |
| Burglary | 306 | 405.5 | 184.2 | 229.0 |
| Larceny | 1,107 | 1,467.1 | 963.6 | 1,272.0 |
| Car Theft | 413 | 547.4 | 231.0 | 259.0 |
Source: FBI Uniform Crime Reporting (2024)
Cost of living in Southfield summary. We use data on the cost of living to determine how expensive it is to live in Southfield. Real estate prices drive most of the variance in cost of living around Michigan. Key points include:
The cost of living in Southfield is 99 with 100 being average.
The cost of living in Southfield is 1.0x lower than the national average.
The median home value in Southfield is $250,952.
The median income in Southfield is $68,166.
Southfield's Overall Cost Of Living
Lower Than The National Average
Cost Of Living In Southfield Comparison Table
| Living Expense | Southfield | Michigan | National Average |
|---|---|---|---|
| Overall | 99 | 91 | 100 |
| Services | 97 | 97 | 100 |
| Groceries | 98 | 98 | 100 |
| Health | 99 | 75 | 100 |
| Housing | 93 | 98 | 100 |
| Transportation | 101 | 101 | 100 |
| Utilities | 99 | 98 | 100 |
Source: Cost of living index, normalized to US average = 100
Southfield, MI Weather
The average high in Southfield is 58.6° and the average low is 40.5°.
There are 72.3 days of precipitation each year.
Expect an average of 32.9 inches of precipitation each year with 35.9 inches of snow.
| Stat | Southfield |
|---|---|
| Average Annual High | 58.6 |
| Average Annual Low | 40.5 |
| Annual Precipitation Days | 72.3 |
| Average Annual Precipitation | 32.9 |
| Average Annual Snowfall | 35.9 |
Average High
Days of Rain
Source: NOAA climate normals (30-year)
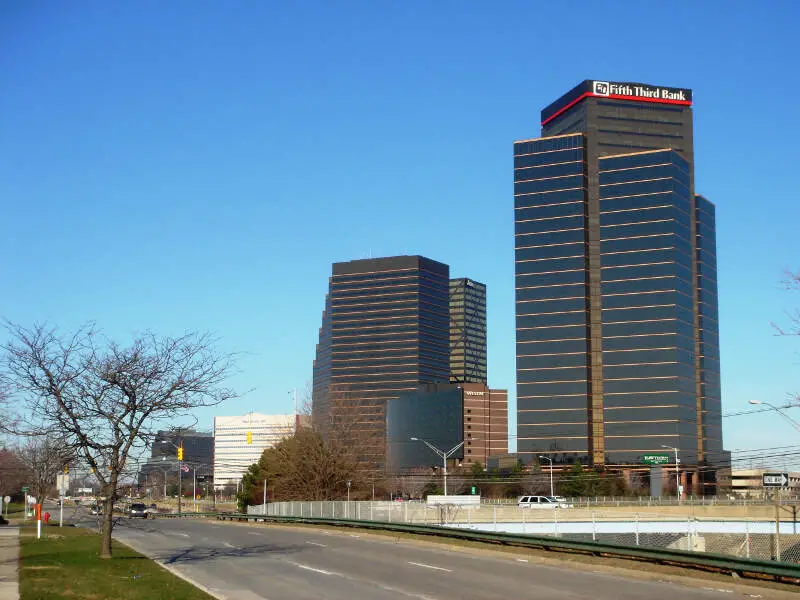
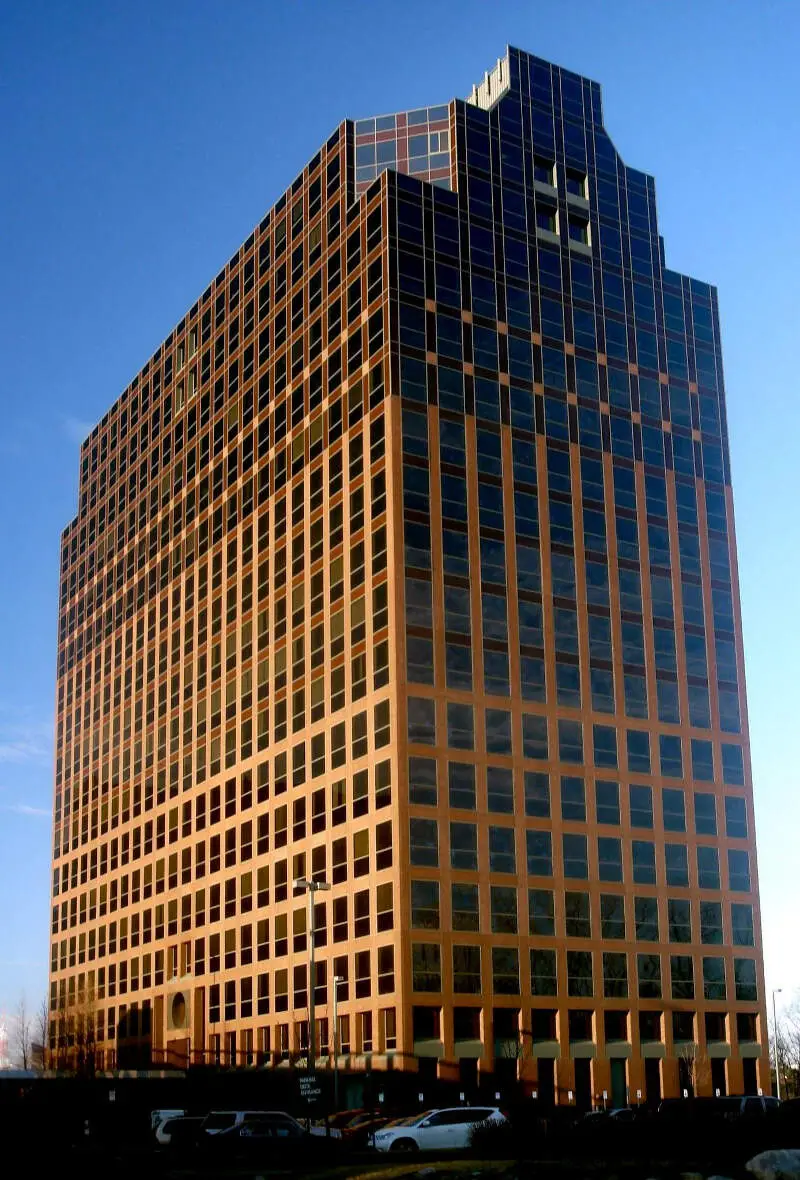
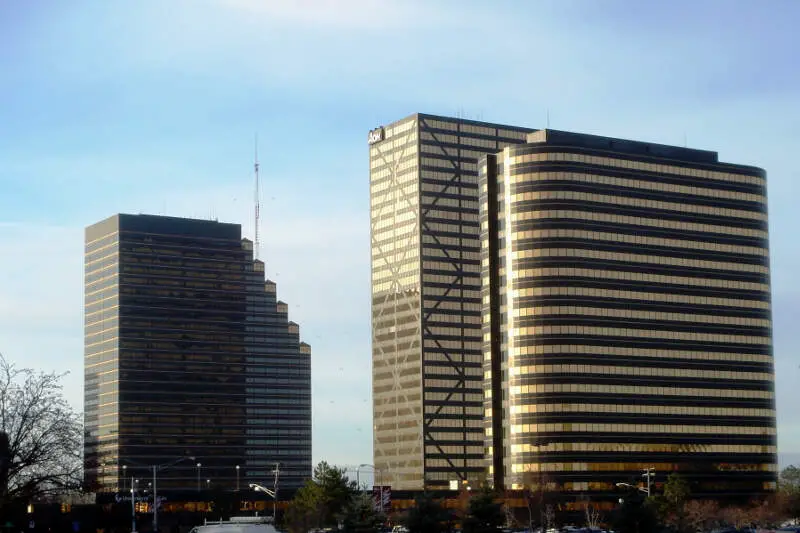
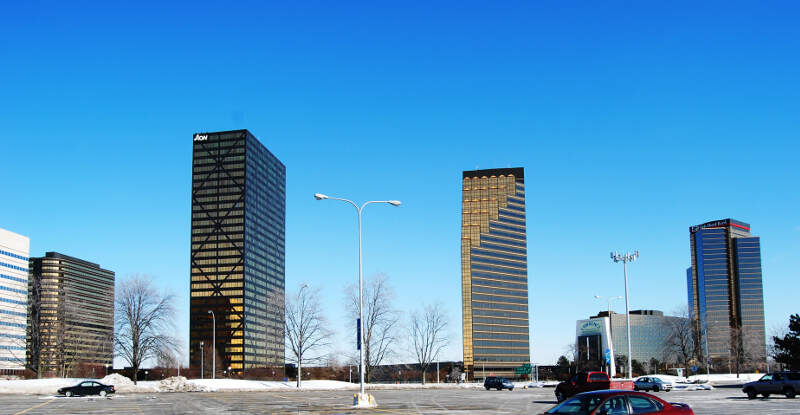
Southfield, MI Photos


Rankings & Articles For Southfield


Locations Around Southfield
Map Of Southfield, MI
Best Places Around Southfield
Sharon, MA
Population 6,232
Needham, MA
Population 32,459
Newton, MA
Population 89,044
Brookline, MA
Population 63,266
Medfield, MA
Population 6,849
Milton, MA
Population 28,587
Cambridge, MA
Population 118,796
Somerville, MA
Population 81,036
Hingham, MA
Population 5,130
Dedham, MA
Population 25,237
Southfield Demographics And Statistics
Population over time in Southfield
The current population in Southfield is 76,236. The population has increased 4.5% from 2010.
| Year | Population | % Change |
|---|---|---|
| 2024 | 76,236 | 0.3% |
| 2023 | 76,025 | -0.1% |
| 2022 | 76,107 | -0.1% |
| 2021 | 76,196 | 4.4% |
| 2020 | 72,966 | -0.3% |
| 2019 | 73,174 | -0.3% |
| 2018 | 73,392 | 0.2% |
| 2017 | 73,228 | 0.2% |
| 2016 | 73,055 | 0.3% |
| 2015 | 72,859 | 0.5% |
| 2014 | 72,480 | 0.2% |
| 2013 | 72,331 | 0.1% |
| 2012 | 72,280 | -0.3% |
| 2011 | 72,502 | -0.6% |
| 2010 | 72,949 | - |
Race / Ethnicity in Southfield
See the full breakdown
Southfield is:
24.5% White with 18,667 White residents.
64.7% African American with 49,336 African American residents.
0.0% American Indian with 37 American Indian residents.
2.0% Asian with 1,541 Asian residents.
0.0% Hawaiian with 20 Hawaiian residents.
0.3% Other with 242 Other residents.
6.7% Two Or More with 5,102 Two Or More residents.
1.7% Hispanic with 1,291 Hispanic residents.
| Race | Southfield | MI | USA |
|---|---|---|---|
| White | 24.5% | 72.4% | 57.4% |
| African American | 64.7% | 13.1% | 11.9% |
| American Indian | 0.0% | 0.3% | 0.5% |
| Asian | 2.0% | 3.4% | 5.9% |
| Hawaiian | 0.0% | 0.0% | 0.2% |
| Other | 0.3% | 0.5% | 0.6% |
| Two Or More | 6.7% | 4.5% | 4.3% |
| Hispanic | 1.7% | 5.9% | 19.3% |
Gender in Southfield
See the full breakdown
Southfield is 53.9% female with 41,128 female residents.
Southfield is 46.1% male with 35,108 male residents.
| Gender | Southfield | MI | USA |
|---|---|---|---|
| Female | 53.9% | 50.4% | 50.5% |
| Male | 46.1% | 49.6% | 49.5% |
Highest level of educational attainment in Southfield for adults over 25
See the full breakdown
-0.0% of adults in Southfield completed < 9th grade.
3.0% of adults in Southfield completed 9-12th grade.
19.0% of adults in Southfield completed high school / ged.
27.0% of adults in Southfield completed some college.
9.0% of adults in Southfield completed associate's degree.
22.0% of adults in Southfield completed bachelor's degree.
16.0% of adults in Southfield completed master's degree.
3.0% of adults in Southfield completed professional degree.
1.0% of adults in Southfield completed doctorate degree.
| Education | Southfield | MI | USA |
|---|---|---|---|
| < 9th Grade | -0.0% | 3.0% | 4.0% |
| 9-12th Grade | 3.0% | 5.0% | 6.0% |
| High School / GED | 19.0% | 28.0% | 26.0% |
| Some College | 27.0% | 22.0% | 19.0% |
| Associate's Degree | 9.0% | 10.0% | 9.0% |
| Bachelor's Degree | 22.0% | 20.0% | 22.0% |
| Master's Degree | 16.0% | 9.0% | 10.0% |
| Professional Degree | 3.0% | 2.0% | 2.0% |
| Doctorate Degree | 1.0% | 1.0% | 2.0% |
Household Income For Southfield, Michigan
See the full breakdown
5.6% of households in Southfield earn Less than $10,000.
4.1% of households in Southfield earn $10,000 to $14,999.
9.1% of households in Southfield earn $15,000 to $24,999.
7.0% of households in Southfield earn $25,000 to $34,999.
10.2% of households in Southfield earn $35,000 to $49,999.
19.5% of households in Southfield earn $50,000 to $74,999.
13.8% of households in Southfield earn $75,000 to $99,999.
15.6% of households in Southfield earn $100,000 to $149,999.
7.7% of households in Southfield earn $150,000 to $199,999.
7.5% of households in Southfield earn $200,000 or more.
| Income | Southfield | MI | USA |
|---|---|---|---|
| Less than $10,000 | 5.6% | 5.2% | 5.0% |
| $10,000 to $14,999 | 4.1% | 3.8% | 3.4% |
| $15,000 to $24,999 | 9.1% | 6.8% | 6.3% |
| $25,000 to $34,999 | 7.0% | 7.3% | 6.6% |
| $35,000 to $49,999 | 10.2% | 11.4% | 10.1% |
| $50,000 to $74,999 | 19.5% | 16.8% | 15.5% |
| $75,000 to $99,999 | 13.8% | 13.2% | 12.6% |
| $100,000 to $149,999 | 15.6% | 17.3% | 17.5% |
| $150,000 to $199,999 | 7.7% | 8.6% | 9.6% |
| $200,000 or more | 7.5% | 9.5% | 13.4% |
Source: U.S. Census ACS 5-year estimates (2024)


