
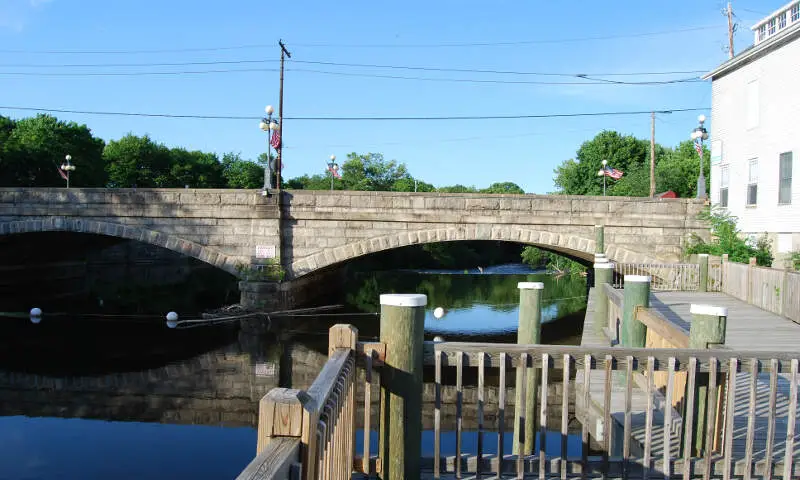
Before you decide to relocate to Rhode Island, it’s important to research the exact cost of living around the state. And that’s what we’re going to help you do.
These are the places in Rhode Island that cost a pretty penny — the most expensive cities in the state.
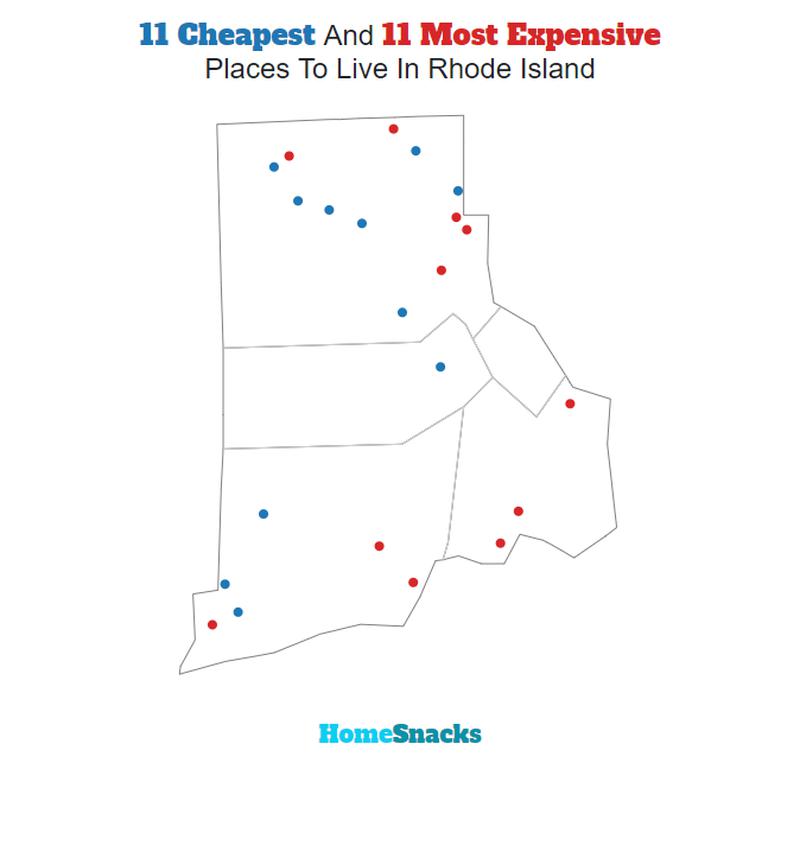
We used Saturday Night Science to compare the 2019-2023 American Community Survey on cost of living for the 15 places in Rhode Island with more than 6,000 people.
After we saved up for months and could finally afford it, we landed on this list of the ten most expensive cities in Rhode Island for 2025.
Table Of Contents: Top Ten | Methodology | Summary | Table
The 10 Most Expensive Places To Live In Rhode Island For 2025
What’s the most expensive place to live in Rhode Island? Well, HomeSnacks crunched the numbers and discovered that Newport is the most expensive place to live in Rhode Island.
Central Falls (the cheapest place to live in Rhode Island) can show these guys how to live on a budget in the coming years. Read on for how these places had costs rise faster than inflation.
And if you already knew these places were expensive, check out some more reading about Rhode Island and the most expensive cities in the country:
The 10 Most Expensive Places To Live In Rhode Island For 2025


/10
Population: 25,029
Cost Of Living Index: 133
Median Income: $83,562
Average Home Price: $669,500
Home Price To Income Ratio: 8.0x
More on Newport: Data
The overall cost of living in Newport is 133. The median income in Newport comes in at $83,562 and the average home value is $669,500 for 2025.

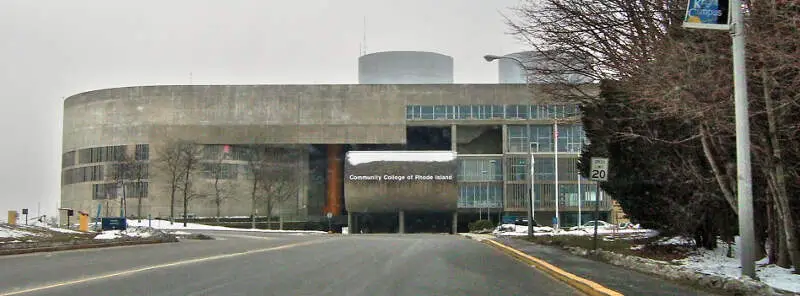
/10
Population: 11,262
Cost Of Living Index: 124
Median Income: $86,310
Average Home Price: $479,200
Home Price To Income Ratio: 5.6x
More on Newport East: Data
The overall cost of living in Newport East is 124. The median income in Newport East comes in at $86,310 and the average home value is $479,200 for 2025.

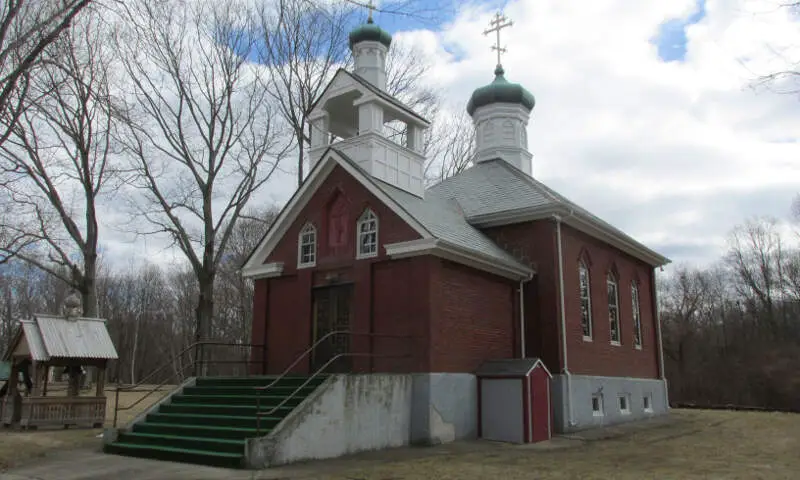
/10
Population: 6,953
Cost Of Living Index: 124
Median Income: $82,143
Average Home Price: $493,500
Home Price To Income Ratio: 6.0x
More on Kingston: Data
The overall cost of living in Kingston is 124. The median income in Kingston comes in at $82,143 and the average home value is $493,500 for 2025.

/10
Population: 18,528
Cost Of Living Index: 121
Median Income: $82,333
Average Home Price: $400,200
Home Price To Income Ratio: 4.9x
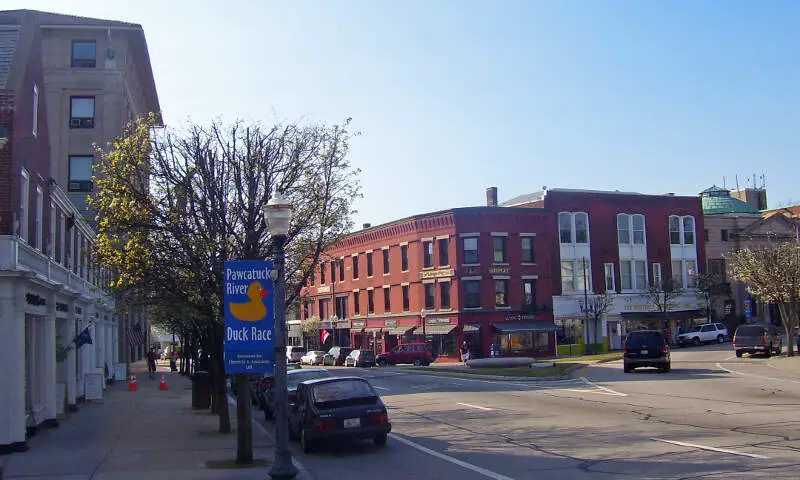
More on Westerly: Data
The overall cost of living in Westerly is 121. The median income in Westerly comes in at $82,333 and the average home value is $400,200 for 2025.

/10
Population: 8,586
Cost Of Living Index: 118
Median Income: $94,567
Average Home Price: $390,900
Home Price To Income Ratio: 4.1x
More on Greenville: Data
The overall cost of living in Greenville is 118. The median income in Greenville comes in at $94,567 and the average home value is $390,900 for 2025.

/10
Population: 8,638
Cost Of Living Index: 115
Median Income: $131,006
Average Home Price: $362,700
Home Price To Income Ratio: 2.8x
More on Cumberland Hill: Data
The overall cost of living in Cumberland Hill is 115. The median income in Cumberland Hill comes in at $131,006 and the average home value is $362,700 for 2025.

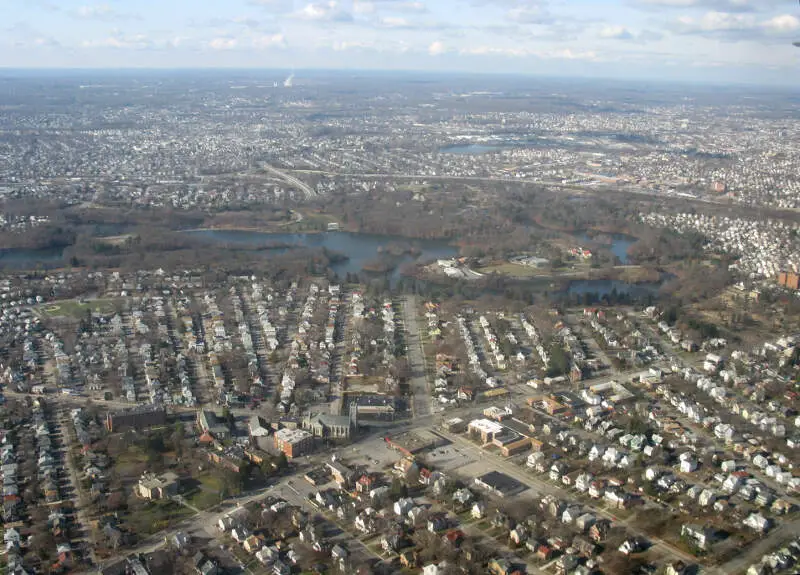
/10
Population: 82,871
Cost Of Living Index: 113
Median Income: $87,536
Average Home Price: $322,000
Home Price To Income Ratio: 3.7x
More on Warwick: Data
The overall cost of living in Warwick is 113. The median income in Warwick comes in at $87,536 and the average home value is $322,000 for 2025.

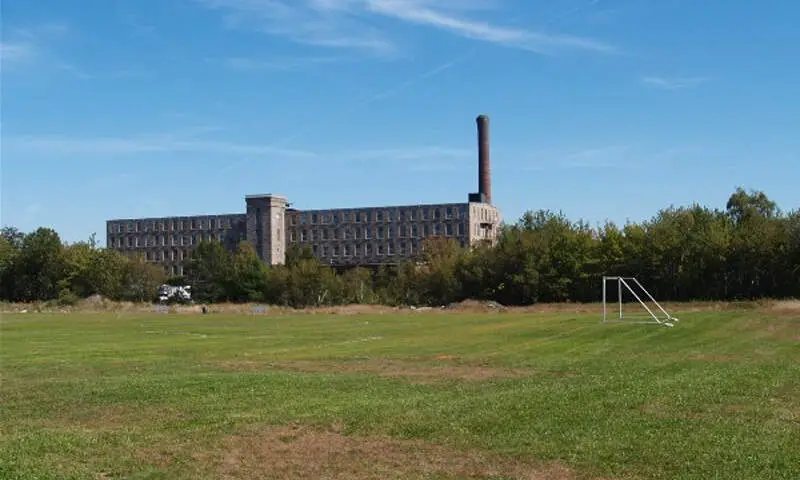
/10
Population: 8,151
Cost Of Living Index: 113
Median Income: $91,493
Average Home Price: $357,700
Home Price To Income Ratio: 3.9x
More on Tiverton: Data
The overall cost of living in Tiverton is 113. The median income in Tiverton comes in at $91,493 and the average home value is $357,700 for 2025.

/10
Population: 82,632
Cost Of Living Index: 111
Median Income: $87,716
Average Home Price: $348,800
Home Price To Income Ratio: 4.0x
More on Cranston: Data
The overall cost of living in Cranston is 111. The median income in Cranston comes in at $87,716 and the average home value is $348,800 for 2025.

/10
Population: 12,370
Cost Of Living Index: 109
Median Income: $93,653
Average Home Price: $347,900
Home Price To Income Ratio: 3.7x
More on Valley Falls: Data
The overall cost of living in Valley Falls is 109. The median income in Valley Falls comes in at $93,653 and the average home value is $347,900 for 2025.
Methodology: How We Determined The Most Expensive Places To Live In The Ocean State For 2025
The two most important things to think about when it comes to being able to afford a city in Rhode Island are:
- How much money do I make?
- How much do I have to spend to live there?
You need to understand your costs in the context of how much money you make.
For example, if the median household earns $100,000 and spends $40,000 on housing, it’s actually cheaper to live there than a place with a median income of $50,000 and housing costs of $21,000. You might spend more on housing, but you have more money overall to play with.
With that example in mind, we derived several statistics from the latest Census American Community Survey 2019-2023 around incomes and costs. They are:
- Overall Cost Of Living Index
- Median Home Price / Median Income (lower is better)
- Median Income / Median Rent (Higher is better)
- Median Home Price
You can then compare these metrics in each of the places in Rhode Island to figure out which is the most expensive.
You are left with a “Cost of Living Index” by taking the average rank of each of these metrics for each city.
So we used that cost of living index to rank all of the 15 places in Rhode Island that have more than 6,000 people.
The place with the highest cost of living in Rhode Island according to the data is Newport. We updated this article for 2025. This article is our tenth time ranking the most expensive places to live in Rhode Island.
Summary: Taking A Chunk Out Of Your Paycheck In Rhode Island For 2025
Well, there you have it, the places in Rhode Island that have the highest cost of living, with Newport ranking as the most expensive city in the Ocean State.
The most expensive cities in Rhode Island are Newport, Newport East, Kingston, Westerly, Greenville, Cumberland Hill, Warwick, Tiverton, Cranston, and Valley Falls.
Here’s a look at the most affordable cities in Rhode Island according to the data:
- Central Falls
- Woonsocket
- Pawtucket
For more Rhode Island reading, check out:
- Best Places To Live In Rhode Island
- Cheapest Places To Live In Rhode Island
- Most Dangerous Cities In Rhode Island
- Best Places To Raise A Family In Rhode Island
- Safest Places In Rhode Island
- Worst Places To Live In Rhode Island
Most Expensive Cities In Rhode Island
| Rank | City | Cost Of Living | Population | Median Income | Average Home Price | Home/Income Ratio |
|---|---|---|---|---|---|---|
| 1 | Newport | 133 | 25,029 | $83,562 | $669,500 | 8.0x |
| 2 | Newport East | 124 | 11,262 | $86,310 | $479,200 | 5.6x |
| 3 | Kingston | 124 | 6,953 | $82,143 | $493,500 | 6.0x |
| 4 | Westerly | 121 | 18,528 | $82,333 | $400,200 | 4.9x |
| 5 | Greenville | 118 | 8,586 | $94,567 | $390,900 | 4.1x |
| 6 | Cumberland Hill | 115 | 8,638 | $131,006 | $362,700 | 2.8x |
| 7 | Warwick | 113 | 82,871 | $87,536 | $322,000 | 3.7x |
| 8 | Tiverton | 113 | 8,151 | $91,493 | $357,700 | 3.9x |
| 9 | Cranston | 111 | 82,632 | $87,716 | $348,800 | 4.0x |
| 10 | Valley Falls | 109 | 12,370 | $93,653 | $347,900 | 3.7x |
| 11 | East Providence | 108 | 46,970 | $79,660 | $322,100 | 4.0x |
| 12 | Providence | 106 | 190,214 | $66,772 | $322,800 | 4.8x |
| 13 | Pawtucket | 106 | 75,280 | $67,436 | $286,200 | 4.2x |
| 14 | Woonsocket | 105 | 43,074 | $58,614 | $268,000 | 4.6x |
| 15 | Central Falls | 105 | 22,481 | $45,921 | $300,500 | 6.5x |