Anaconda-Deer Lodge County SnackAbility
Overall SnackAbility
Cost of living in Anaconda-Deer Lodge County summary. We use data on the cost of living to determine how expensive it is to live in Anaconda-Deer Lodge County. Real estate prices drive most of the variance in cost of living around Montana. Key points include:
The cost of living in Anaconda-Deer Lodge County is 89 with 100 being average.
The cost of living in Anaconda-Deer Lodge County is 0.9x lower than the national average.
The median home value in Anaconda-Deer Lodge County is $287,878.
The median income in Anaconda-Deer Lodge County is $57,527.
Anaconda-Deer Lodge County's Overall Cost Of Living
Lower Than The National Average
Cost Of Living In Anaconda-Deer Lodge County Comparison Table
| Living Expense | Anaconda-Deer Lodge County | Montana | National Average |
|---|---|---|---|
| Overall | 89 | 102 | 100 |
| Services | 104 | 104 | 100 |
| Groceries | 100 | 103 | 100 |
| Health | 67 | 101 | 100 |
| Housing | 98 | 99 | 100 |
| Transportation | 107 | 105 | 100 |
| Utilities | 99 | 100 | 100 |
Source: Cost of living index, normalized to US average = 100
Anaconda-Deer Lodge County, MT Weather
The average high in Anaconda-Deer Lodge County is 53.3° and the average low is 27.2°.
There are 42.4 days of precipitation each year.
Expect an average of 14.2 inches of precipitation each year with 57.3 inches of snow.
| Stat | Anaconda-Deer Lodge County |
|---|---|
| Average Annual High | 53.3 |
| Average Annual Low | 27.2 |
| Annual Precipitation Days | 42.4 |
| Average Annual Precipitation | 14.2 |
| Average Annual Snowfall | 57.3 |
Average High
Days of Rain
Source: NOAA climate normals (30-year)
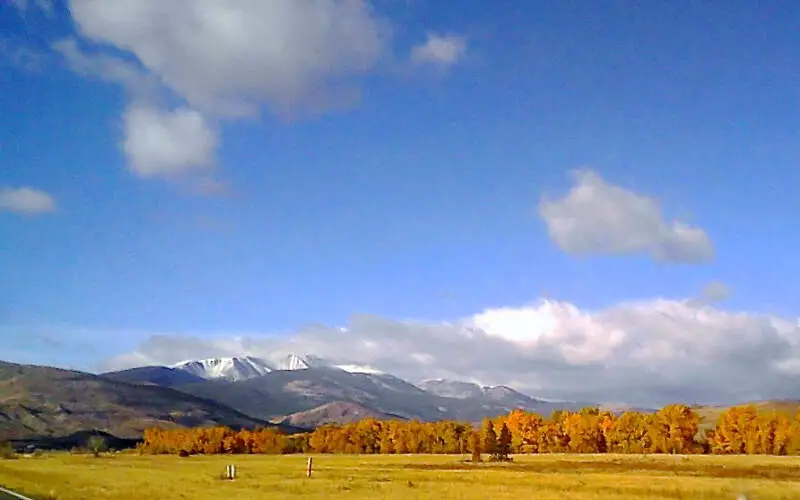
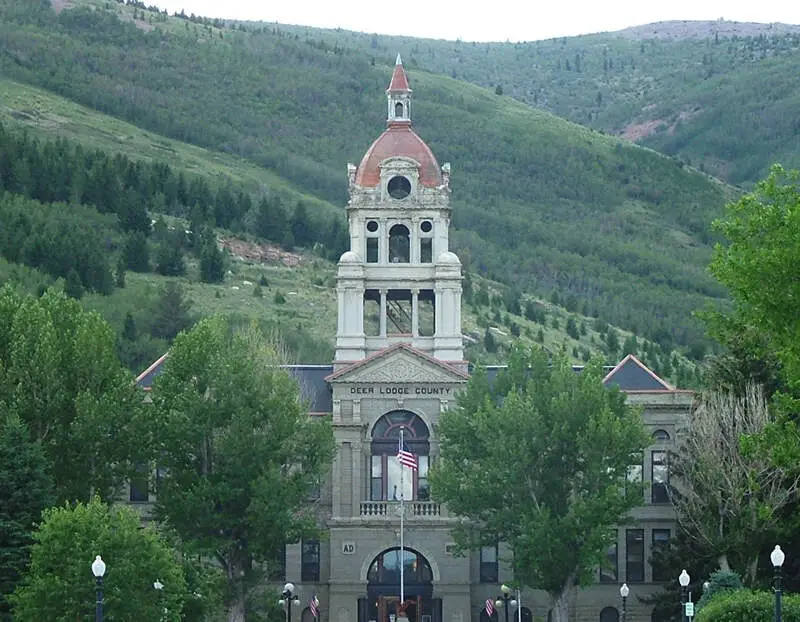
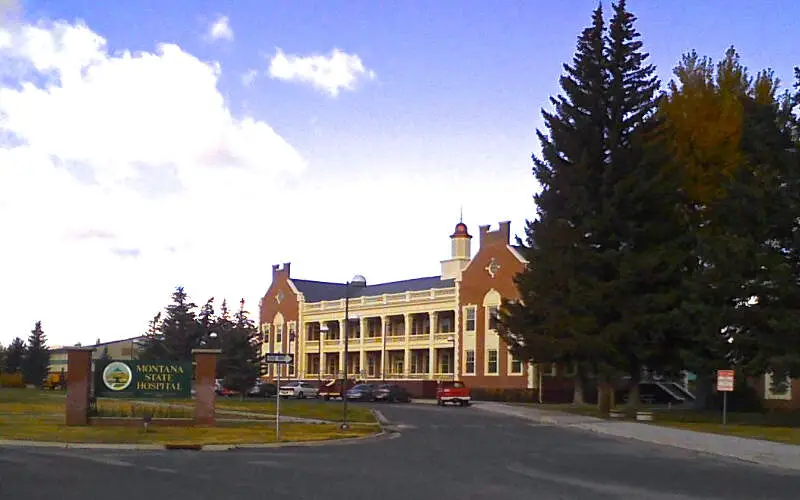
Anaconda-Deer Lodge County, MT Photos
Rankings & Articles For Anaconda-Deer Lodge County


Locations Around Anaconda-Deer Lodge County
Map Of Anaconda-Deer Lodge County, MT
Best Places Around Anaconda-Deer Lodge County
Anaconda-Deer Lodge County Demographics And Statistics
Population over time in Anaconda-Deer Lodge County
The current population in Anaconda-Deer Lodge County is 9,597. The population has increased 3.5% from 2010.
| Year | Population | % Change |
|---|---|---|
| 2024 | 9,597 | 0.9% |
| 2023 | 9,512 | 0.8% |
| 2022 | 9,435 | 0.6% |
| 2021 | 9,380 | 2.5% |
| 2020 | 9,153 | 0.5% |
| 2019 | 9,106 | 0.1% |
| 2018 | 9,100 | - |
| 2017 | 0 | -100.0% |
| 2016 | 9,176 | -0.4% |
| 2015 | 9,211 | -0.3% |
| 2014 | 9,243 | -0.5% |
| 2013 | 9,285 | 0.1% |
| 2012 | 9,277 | -0.2% |
| 2011 | 9,294 | 0.3% |
| 2010 | 9,270 | - |
Race / Ethnicity in Anaconda-Deer Lodge County
See the full breakdown
Anaconda-Deer Lodge County is:
89.3% White with 8,570 White residents.
0.4% African American with 34 African American residents.
1.9% American Indian with 185 American Indian residents.
0.2% Asian with 23 Asian residents.
0.1% Hawaiian with 8 Hawaiian residents.
0.2% Other with 21 Other residents.
4.4% Two Or More with 421 Two Or More residents.
3.5% Hispanic with 335 Hispanic residents.
| Race | Anaconda-Deer Lodge County | MT | USA |
|---|---|---|---|
| White | 89.3% | 83.6% | 57.4% |
| African American | 0.4% | 0.4% | 11.9% |
| American Indian | 1.9% | 5.3% | 0.5% |
| Asian | 0.2% | 0.8% | 5.9% |
| Hawaiian | 0.1% | 0.0% | 0.2% |
| Other | 0.2% | 0.5% | 0.6% |
| Two Or More | 4.4% | 4.7% | 4.3% |
| Hispanic | 3.5% | 4.6% | 19.3% |
Gender in Anaconda-Deer Lodge County
See the full breakdown
Anaconda-Deer Lodge County is 46.7% female with 4,483 female residents.
Anaconda-Deer Lodge County is 53.3% male with 5,113 male residents.
| Gender | Anaconda-Deer Lodge County | MT | USA |
|---|---|---|---|
| Female | 46.7% | 49.3% | 50.5% |
| Male | 53.3% | 50.7% | 49.5% |
Highest level of educational attainment in Anaconda-Deer Lodge County for adults over 25
See the full breakdown
2.0% of adults in Anaconda-Deer Lodge County completed < 9th grade.
6.0% of adults in Anaconda-Deer Lodge County completed 9-12th grade.
36.0% of adults in Anaconda-Deer Lodge County completed high school / ged.
26.0% of adults in Anaconda-Deer Lodge County completed some college.
6.0% of adults in Anaconda-Deer Lodge County completed associate's degree.
16.0% of adults in Anaconda-Deer Lodge County completed bachelor's degree.
6.0% of adults in Anaconda-Deer Lodge County completed master's degree.
1.0% of adults in Anaconda-Deer Lodge County completed professional degree.
1.0% of adults in Anaconda-Deer Lodge County completed doctorate degree.
| Education | Anaconda-Deer Lodge County | MT | USA |
|---|---|---|---|
| < 9th Grade | 2.0% | 1.0% | 4.0% |
| 9-12th Grade | 6.0% | 4.0% | 6.0% |
| High School / GED | 36.0% | 28.0% | 26.0% |
| Some College | 26.0% | 22.0% | 19.0% |
| Associate's Degree | 6.0% | 10.0% | 9.0% |
| Bachelor's Degree | 16.0% | 23.0% | 22.0% |
| Master's Degree | 6.0% | 8.0% | 10.0% |
| Professional Degree | 1.0% | 2.0% | 2.0% |
| Doctorate Degree | 1.0% | 2.0% | 2.0% |
Household Income For Anaconda-Deer Lodge County, Montana
See the full breakdown
4.9% of households in Anaconda-Deer Lodge County earn Less than $10,000.
7.4% of households in Anaconda-Deer Lodge County earn $10,000 to $14,999.
8.1% of households in Anaconda-Deer Lodge County earn $15,000 to $24,999.
8.8% of households in Anaconda-Deer Lodge County earn $25,000 to $34,999.
15.0% of households in Anaconda-Deer Lodge County earn $35,000 to $49,999.
19.0% of households in Anaconda-Deer Lodge County earn $50,000 to $74,999.
13.9% of households in Anaconda-Deer Lodge County earn $75,000 to $99,999.
13.8% of households in Anaconda-Deer Lodge County earn $100,000 to $149,999.
4.5% of households in Anaconda-Deer Lodge County earn $150,000 to $199,999.
4.5% of households in Anaconda-Deer Lodge County earn $200,000 or more.
| Income | Anaconda-Deer Lodge County | MT | USA |
|---|---|---|---|
| Less than $10,000 | 4.9% | 4.2% | 5.0% |
| $10,000 to $14,999 | 7.4% | 3.7% | 3.4% |
| $15,000 to $24,999 | 8.1% | 7.0% | 6.3% |
| $25,000 to $34,999 | 8.8% | 7.6% | 6.6% |
| $35,000 to $49,999 | 15.0% | 11.8% | 10.1% |
| $50,000 to $74,999 | 19.0% | 17.3% | 15.5% |
| $75,000 to $99,999 | 13.9% | 13.6% | 12.6% |
| $100,000 to $149,999 | 13.8% | 17.4% | 17.5% |
| $150,000 to $199,999 | 4.5% | 8.2% | 9.6% |
| $200,000 or more | 4.5% | 9.0% | 13.4% |
Source: U.S. Census ACS 5-year estimates (2024)


