
If you’re not flying down The Big Mountain in Whitefish, hiking Glacier National Park, or jaunting through Custer National Forest in Billings than you’re not taking advantage of the best things that Montana has to offer.
The best places to live in Montana are all a stone’s throw from these attractions.
How’d we determine the best places to live? We used Saturday Night Science to consult the numbers from the Census, FBI, and Zillow. In total, we analyzed the 34 cities for important factors like incomes, crime, rent, and median home values for every place with over 2,000 residents.
We discovered fantastic places in Montana to live for every stage of life and every budget. Take a look.
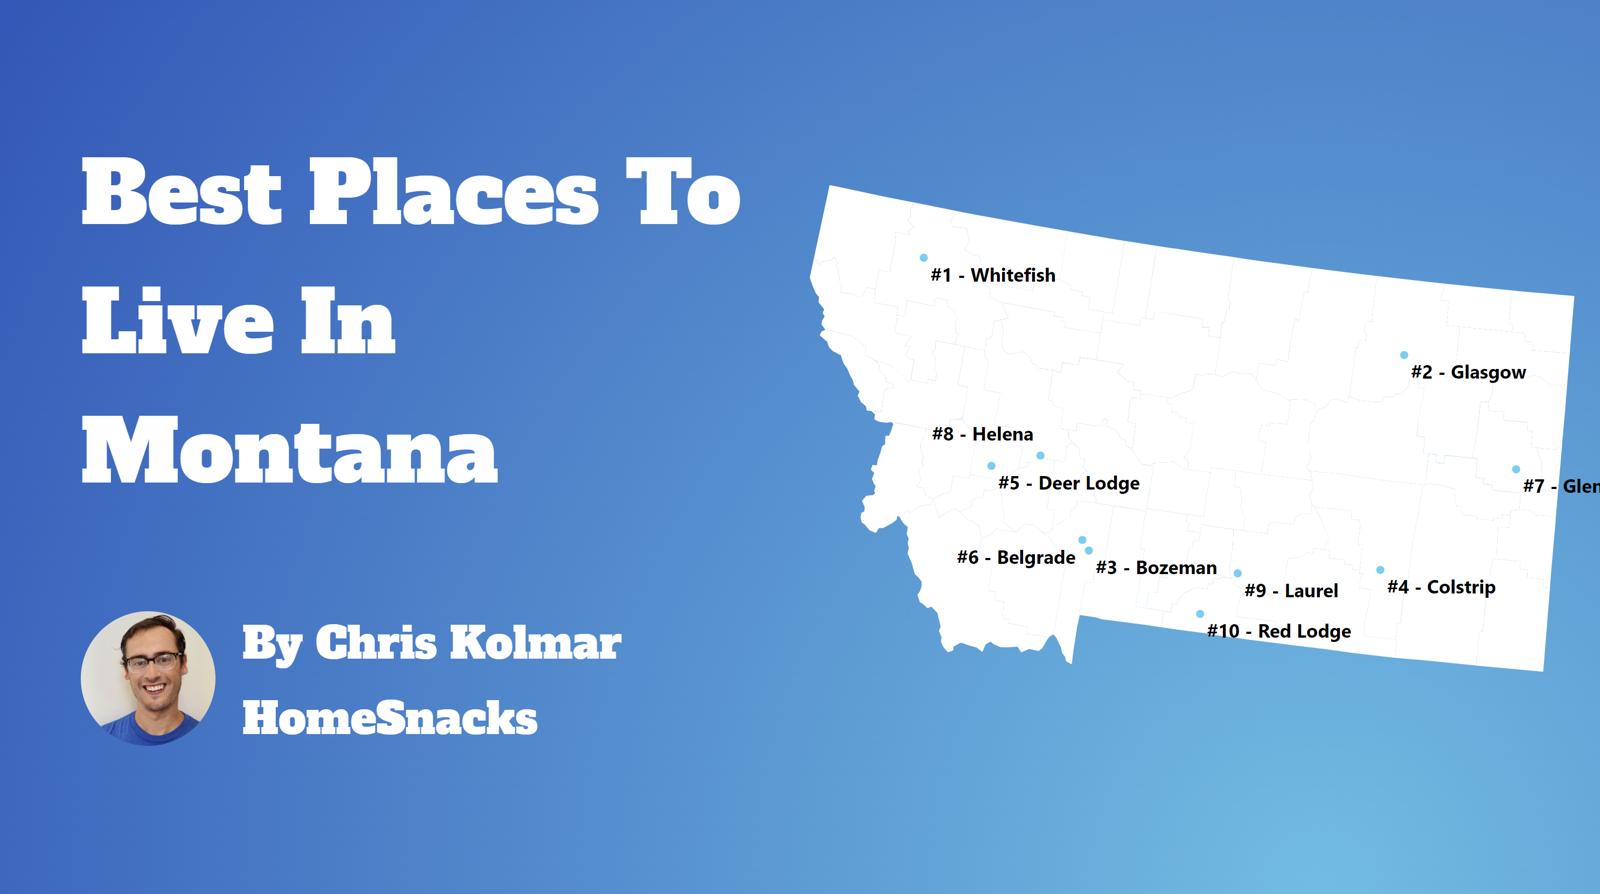
Table Of Contents: Top Ten | Table | Map | Methodology | Summary
What is the best place to live in Montana for 2026? The best places to live in Montana is Glasgow ccording to the US Census, Zillow, and FBI data
If you live in the greater Helena area, consider yourself one lucky Montanan.
For more reading, check out:
The 10 Best Places To Live In Montana For 2026
| Stat | Glasgow | Montana |
|---|---|---|
| Population | 3,190 | 1,116,875 |
| Rank Last Year | 3 | – |
| Median Home Value | $156,841 | $466,916 |
| Median Income | $90,310 | $72,509 |
| Unemployment Rate | 0.5% | 3.6% |
| Crime Per Capita | 0.0160 | 0.0208 |
More on Glasgow: Data | Crime | Movers
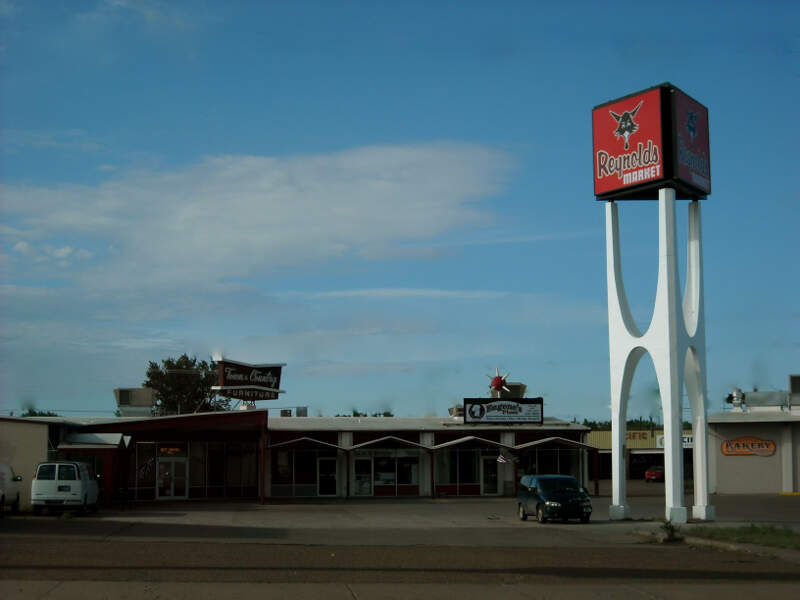
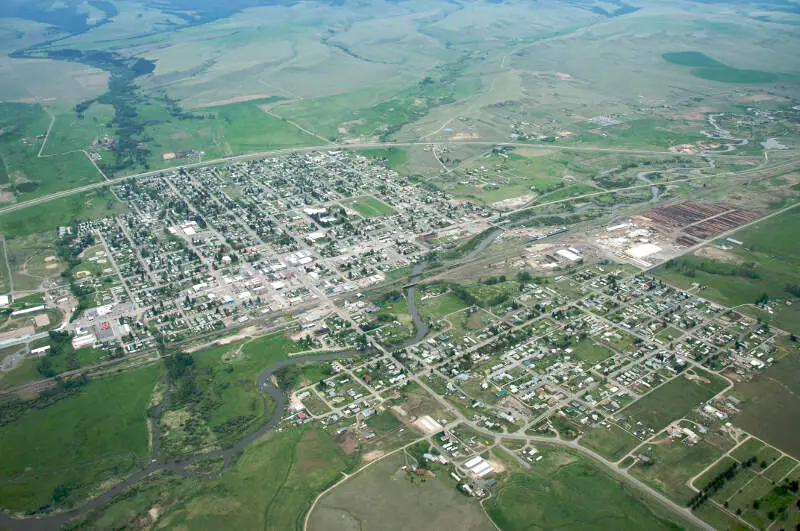
Glasgow is a small city of 3,190, yet it is still a key economic hub for northeastern Montana. Glasgow residents enjoy the 2nd highest median household income in the state at $90,310/year. Like Colstrip, Glasgow’s combination of high pay and low home prices make it an attractive choice for someone looking to save money. And it’s not just like the 1% can succeed in Glasgow, seeing as the poverty level here is 8.0%, the 6th lowest in Montana.
As a nice bonus, Glasgow residents also have the 1st shortest commute time in the state at just 8 minutes. Anyone who’s had a hellish commute in their life will appreciate just how much a short drive to and from work can improve one’s quality of life. Glasgow also has a crime rate roughly 30% lower than the national average, so your chances of getting car-jacked on your commute are basically nil.
If you’ve made the move to Glasgow, we recommend rewarding yourself for your smart planning with a pint from the local Busted Knuckle Brewery.

| Stat | Whitefish | Montana |
|---|---|---|
| Population | 8,749 | 1,116,875 |
| Rank Last Year | 1 | – |
| Median Home Value | $864,156 | $466,916 |
| Median Income | $73,811 | $72,509 |
| Unemployment Rate | 2.4% | 3.6% |
| Crime Per Capita | 0.0134 | 0.0208 |
More on Whitefish: Data | Crime | Cost Of Living | Movers
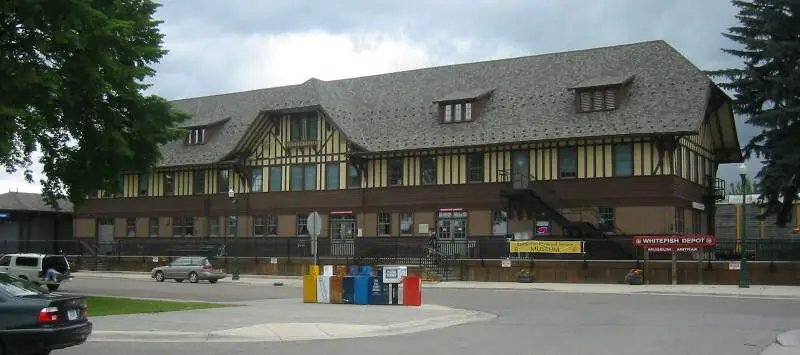
We probably don’t have to try very hard to convince nature-enthusiasts that Whitefish is among the best places to live in Montana. Not when it’s surrounded by Flathead National Forest, Kootenai National Forest, and Glacier National Park. It would take a lifetime to fully explore each of these national treasures, so if you’re bored in Whitefish, you’re doing it wrong. We haven’t even touched on the Whitefish Ski Resort, the city beach, the local farmer’s market, or any of the various annual events that Whitefish puts on.
There’s a catch to all this, unfortunately. Whitefish is quite an expensive place to settle, with a cost of living around 15% higher than the national average and home prices at around $864,156, the 1st costliest in Montana. The good news is that you get to live in a hyper-educated community where about 20% of residents have a master’s degree or higher. And since smart, moneyed individuals don’t have much reason to go out committing felonies, Whitefish also had the 3rd lowest rate of violent crime in Montana.
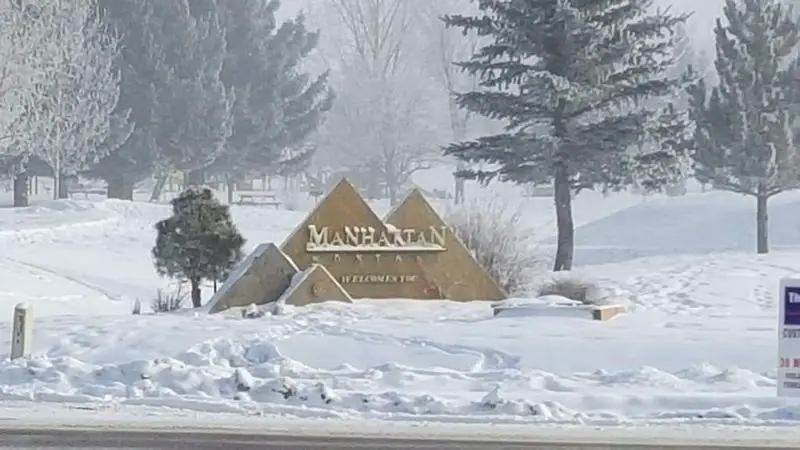
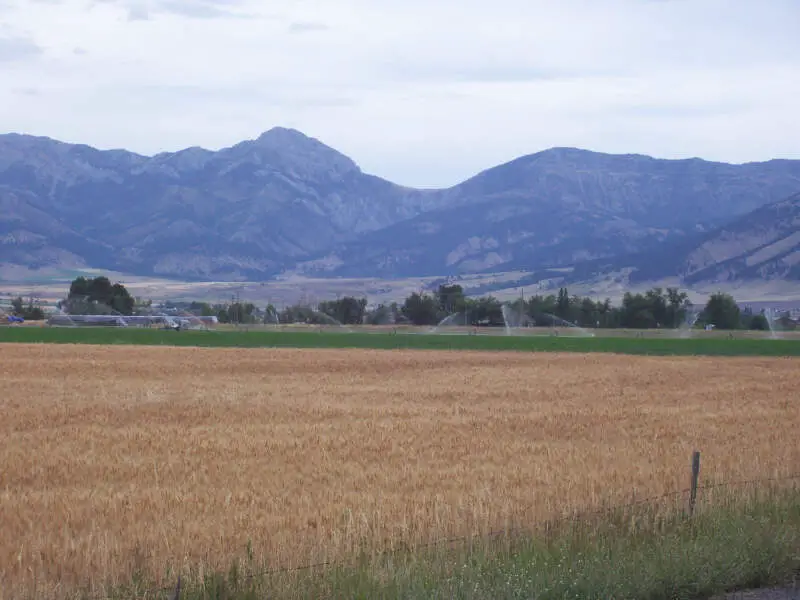
3. Manhattan
| Stat | Manhattan | Montana |
|---|---|---|
| Population | 2,288 | 1,116,875 |
| Rank Last Year | 2 | – |
| Median Home Value | $659,491 | $466,916 |
| Median Income | $87,865 | $72,509 |
| Unemployment Rate | 0.0% | 3.6% |
| Crime Per Capita | 0.0092 | 0.0208 |
More on Manhattan: Movers

| Stat | Bozeman | Montana |
|---|---|---|
| Population | 56,114 | 1,116,875 |
| Rank Last Year | 6 | – |
| Median Home Value | $724,089 | $466,916 |
| Median Income | $85,747 | $72,509 |
| Unemployment Rate | 3.0% | 3.6% |
| Crime Per Capita | 0.0228 | 0.0208 |
More on Bozeman: Data | Crime | Cost Of Living | Movers
Bozeman is an up-and-coming city with plenty to love. Evidently, people agree, because Bozeman’s population has grown by about 25% since 2010. Bozeman appears especially attractive for young people because, at 28, the city has the lowest median age of any place we’re covering here. That’s part of the reason we named Bozeman as one of the best cities for singles in Montana. The other is the abundance of fun things to do in Bozeman. Date ideas include a day out at the Museum of the Rockies, attending a MSU football game, shopping ’til you drop in Downtown Bozeman, and hiking at nearby Palisade Falls. You could even probably squeeze all that into one day if you’re extra ambitious.
Bozeman’s public schools are also quite good, with GreatSchools giving a 7.5/10 average score to the district. And with the 8th lowest high school dropout rate in Montana, we think that whatever they’re doing is working well.
The catch: Bozeman is also the most expensive city in Montana, with home prices at $724,089, the 2nd priciest in the state, and a cost of living roughly 10% higher than the national average. Folks here also earn the 4th highest median household income in Montana, though, so if you can lock down a job paying around $85,747/year you should be alright.
| Stat | Dillon | Montana |
|---|---|---|
| Population | 4,085 | 1,116,875 |
| Rank Last Year | 16 | – |
| Median Home Value | $391,899 | $466,916 |
| Median Income | $61,134 | $72,509 |
| Unemployment Rate | 1.2% | 3.6% |
| Crime Per Capita | 0.0081 | 0.0208 |
More on Dillon: Data | Crime | Movers
Dillon is widely recognized as one of Montana’s best places to live. With a population of 4,085 and a median income of $61,134, Dillon offers its residents a high quality of life at a relatively low cost. The median home price in this city is $391,899, making it an affordable option for those looking to settle down.
Located in southwestern Montana off of I15, the town is close to ClarkâÂÂs Lookout State Park, which brings people from all over the county out for weekend hikes. The University of Montana Western also offers a nice place to spend the afternoon.
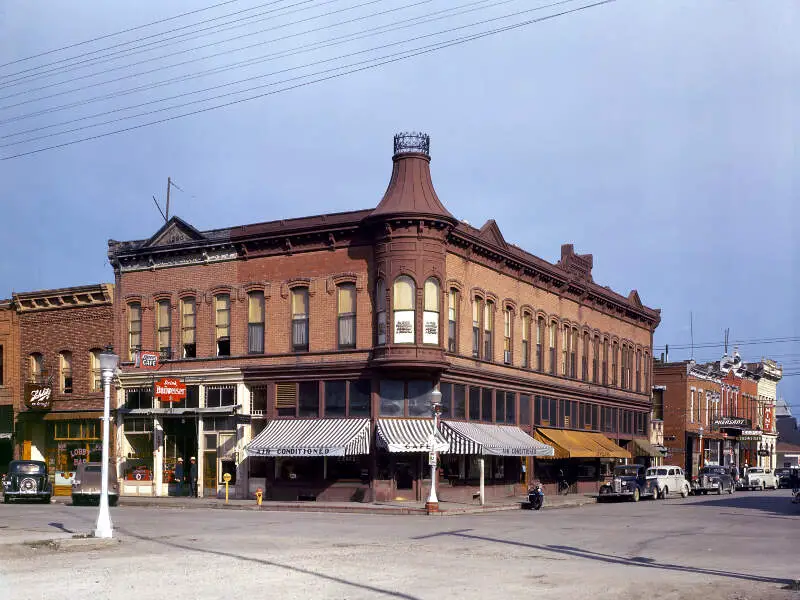
6. Deer Lodge
| Stat | Deer Lodge | Montana |
|---|---|---|
| Population | 3,021 | 1,116,875 |
| Rank Last Year | 7 | – |
| Median Home Value | $285,278 | $466,916 |
| Median Income | $60,302 | $72,509 |
| Unemployment Rate | 3.3% | 3.6% |
| Crime Per Capita | 0.0122 | 0.0208 |
More on Deer Lodge: Crime | Movers
Deer Lodge is no stranger to the HomeSnacks spotlight; we ranked it among the best places to raise a family and the most affordable places in Montana.
Deer Lodge is known for being home to the Old Montana Prison, but you’re unlikely to find any residents actually behind bars. That’s because Deer Lodge has the 11th lowest overall crime rate in Montana — about 66% lower than the national average.
Additionally, with a sub-1% unemployment rate, Deer Lodge enjoys the 16th best job numbers in Montana. This may explain why Deer Lodge residents are insured at the 7th highest rate statewide. Homes in Deer Lodge sell for a median price of $285,278, and the median household income is $60,302. That combination of statistics gives the city one of the best home price to income ratios in the state.
Deer Lodge does have a high median age of 49, so expect a more slow-paced community. Locals love their cowboy heritage, on display at the Grant-Kohrs Ranch, and enjoying the finer things in life (like classic cars) at the local Powell County Museum.

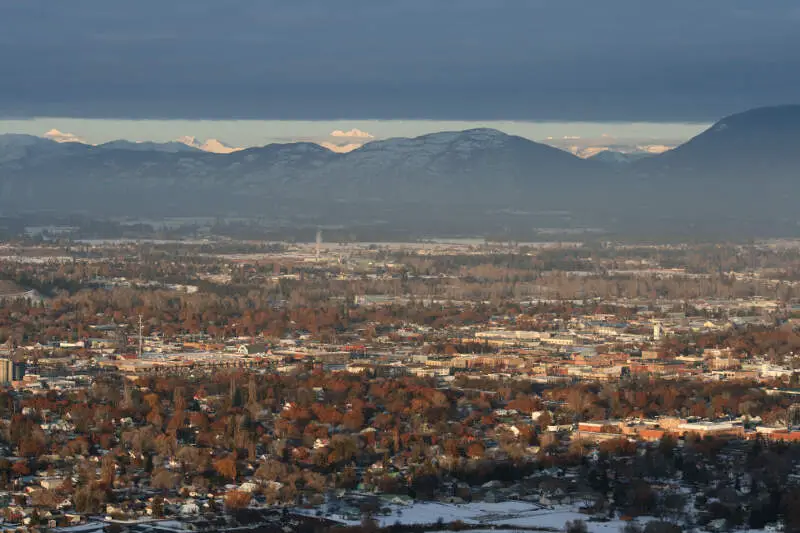
| Stat | Kalispell | Montana |
|---|---|---|
| Population | 28,504 | 1,116,875 |
| Rank Last Year | 12 | – |
| Median Home Value | $552,745 | $466,916 |
| Median Income | $63,415 | $72,509 |
| Unemployment Rate | 2.6% | 3.6% |
| Crime Per Capita | 0.0281 | 0.0208 |
More on Kalispell: Data | Crime | Cost Of Living | Movers
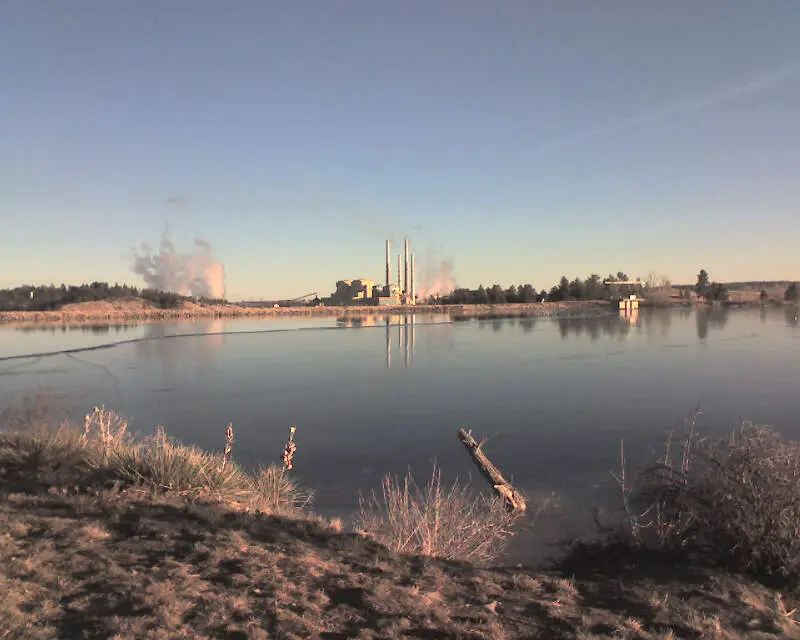
8. Colstrip
| Stat | Colstrip | Montana |
|---|---|---|
| Population | 2,101 | 1,116,875 |
| Rank Last Year | 4 | – |
| Median Home Value | $226,809 | $466,916 |
| Median Income | $82,500 | $72,509 |
| Unemployment Rate | 8.2% | 3.6% |
| Crime Per Capita | 0.0010 | 0.0208 |
More on Colstrip: Crime | Movers
Colstrip moved up to the top spot for 2026 after finishing a close second last year, so things seem to just keep getting better here. While Colstrip has the 5th highest median household income in Montana, $82,500/year, homes here are quite cheap at around $226,809. In fact, everything is a bit more affordable in Colstrip. The cost of living in Colstrip is about 20% lower than the statewide average, so things like groceries, utilities, and rent won’t put a big dent in your finances here. 92.8% of Colstrip residents also have health insurance, the 16th highest rate in the state, so going to the doctor here won’t bankrupt you either.
Colstrip has the 10th lowest poverty level in Montana at 9.4%, meaning the economy is working for everyone in this city. We also named Colstrip the safest place in Montana, so criminal activity is basically non-existent here.
As a nice bonus for outdoorsy folks, Colstrip’s Castle Rock Lake is one of the premier fishing spots in the region. Even if you’re just coming for a hike or a picnic, the picturesque scenery makes for a delightful day out.

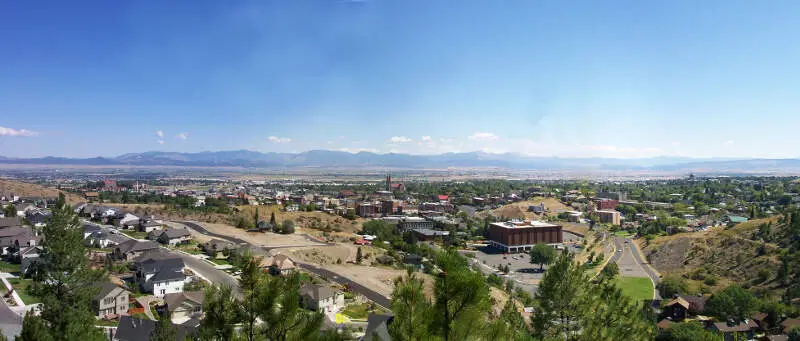
| Stat | Helena | Montana |
|---|---|---|
| Population | 33,639 | 1,116,875 |
| Rank Last Year | 10 | – |
| Median Home Value | $474,028 | $466,916 |
| Median Income | $71,036 | $72,509 |
| Unemployment Rate | 2.9% | 3.6% |
| Crime Per Capita | 0.0324 | 0.0208 |
More on Helena: Data | Crime | Cost Of Living | Movers
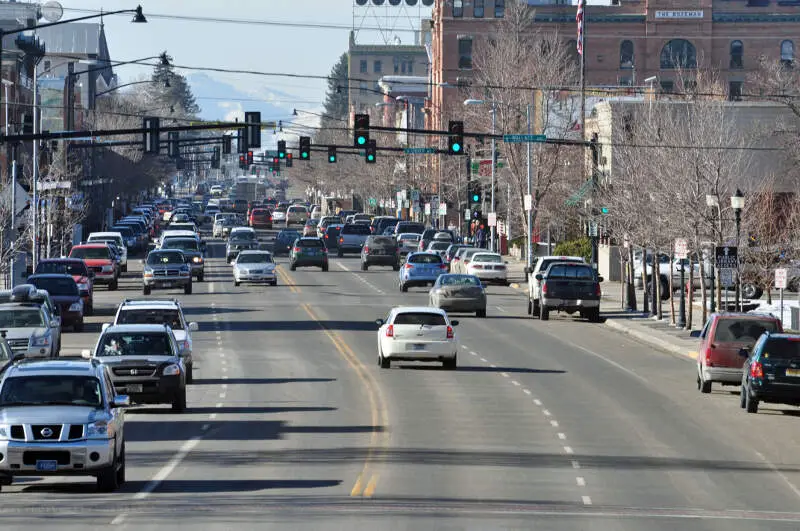
Helena is one of the best places to live in Montana for more reasons than we can count.
The town embodies the essence of the Western spirit, creating the perfect setting for adventure. You can explore 75 miles of trails in the South Hills or spend a day walking through Carroll College and the Mansion District.
Home to the Montana State Capitol building, home prices are 474,028 and rents are $1,092 per month.

| Stat | Belgrade | Montana |
|---|---|---|
| Population | 11,872 | 1,116,875 |
| Rank Last Year | 8 | – |
| Median Home Value | $548,236 | $466,916 |
| Median Income | $97,328 | $72,509 |
| Unemployment Rate | 3.0% | 3.6% |
| Crime Per Capita | 0.0166 | 0.0208 |
More on Belgrade: Data | Crime | Cost Of Living | Movers
Belgrade is a suburban city of 11,872 located 15 minutes northwest of Bozeman. GreatSchools gave Belgrade’s elementary schools an average rating of 7.5/10, so parents can rest easy knowing that they’re giving their kiddos the best possible start in life. Belgrade’s economy is also cause for considerable envy, considering it has the 16th lowest poverty level and 14th lowest unemployment rate in Montana, at 11.2% and 3.0% respectively.
If you decide to settle down in Belgrade, homes go for a median price of $548,236. The median household income in Belgrade is $97,328/year, so you may want to make sure you can bring in about that much if you want to live comfortably here. Besides the obvious advantage of having such a vibrant city of Bozeman just down the road, Belgrade also has plenty of goodies for outdoorsmen and women who’d rather escape the big crowds.
Mapping The Best And Worst Places To Live in Montana
Best Places To Live In Montana Size Requirement
Before we even started to collect data on the best places to live in Montana, we had to answer a tough question: Is it fair to pit Helena, with a population of 33,639, against places with a population of 18?
We firmly decided no, that just isn’t fair.
So, to create our ranking, we broke the best places to live into three tiers:
- Cities — Populations over 2,000
- Towns — Populations between 1,000 and 2,000
- Small Towns — Populations below 1,000
This filter left 34 cities, 62 towns, and 215 small towns.
We then decided no matter how much anyone loves their town, the best cities to live in Montana have more of everything, and therefore, you need over 2,000 people to truly be ‘the best.’
Methodology: How We Calculated The Best Cities To Live In Montana
Now that we had our set of the best possible cities, it was time to rank them using Saturday Night Science.
We ranked each place in Montana across a number of criteria from one to 34, with one being the best.
We then took the average rank across all criteria, crowning the city posting the lowest overall score, the “Best Place To Live In Montana.”
The criteria we looked to determine the best places were:
- Median Home Values
- Median Income
- Population Density (Higher is better)
- Unemployment Rate
- Commute Time
- Crime
- Education Levels
- Health Insurance Coverage
- Poverty rates
Sources of criteria include the New Census Data, FBI Crime Data, and Zillow. We updated this article for 2026. This report is our eleventh time ranking Montana’s best places to live.
If your city or town isn’t among the top 10, jump down to the bottom of the post to see a detailed chart of the best places in Montana. Otherwise, buckle up for a ride down good living lane with Glasgow at the end of the cul-de-sac.
Summary: The Best Places In Montana
If you’re looking at areas in Montana with the best economic situations, where there’s lower than average crime, and a lot to do, this is an accurate list.
The best places to live in Montana are Glasgow, Whitefish, Manhattan, Bozeman, Dillon, Deer Lodge, Kalispell, Colstrip, Helena, and Belgrade.
Glasgow made a strong showing to take in the overall number one spot for the best place to live in Montana for 2026.
If you’re curious enough, here are the worst places to live in Montana according to the data:
- Ronan (Pop. 2,001)
- Roundup (Pop. 2,003)
- Polson (Pop. 5,428)
For more Montana reading, check out:
- Cheapest Places To Live In Montana
- Most Dangerous Cities In Montana
- Best Places To Raise A Family In Montana
- Best Places To Retire In Montana
- Richest Cities In Montana
- Safest Places In Montana
- Worst Places To Live In Montana
Best Places To Live In Montana Table
| Rank | City | Population | Unemployment Rate | Home Value | Median Income | Rent | Crime Per Capita |
|---|---|---|---|---|---|---|---|
| 1 | Glasgow | 3,190 | 0.5% | $156,841 | $90,310 | $805 | 0.0160 |
| 2 | Whitefish | 8,749 | 2.4% | $864,156 | $73,811 | $1,354 | 0.0134 |
| 3 | Manhattan | 2,288 | 0.0% | $659,491 | $87,865 | $1,585 | 0.0092 |
| 4 | Bozeman | 56,114 | 3.0% | $724,089 | $85,747 | $1,717 | 0.0228 |
| 5 | Dillon | 4,085 | 1.2% | $391,899 | $61,134 | $864 | 0.0081 |
| 6 | Deer Lodge | 3,021 | 3.3% | $285,278 | $60,302 | $852 | 0.0122 |
| 7 | Kalispell | 28,504 | 2.6% | $552,745 | $63,415 | $1,078 | 0.0281 |
| 8 | Colstrip | 2,101 | 8.2% | $226,809 | $82,500 | $659 | 0.0010 |
| 9 | Helena | 33,639 | 2.9% | $474,028 | $71,036 | $1,092 | 0.0324 |
| 10 | Belgrade | 11,872 | 3.0% | $548,236 | $97,328 | $1,877 | 0.0166 |
| 11 | Malta | 2,100 | 0.0% | $240,905 | $54,483 | $631 | 0.0308 |
| 12 | Red Lodge | 2,502 | 2.8% | $523,071 | $55,750 | $717 | 0.0064 |
| 13 | Sidney | 6,171 | 3.4% | $269,780 | $62,538 | $931 | 0.0113 |
| 14 | Laurel | 7,215 | 2.4% | $374,156 | $68,474 | $974 | 0.0413 |
| 15 | Missoula | 76,514 | 3.8% | $564,622 | $70,392 | $1,189 | 0.0436 |
| 16 | Hamilton | 5,101 | 2.0% | $526,561 | $49,204 | $947 | 0.0288 |
| 17 | Columbus | 2,003 | 3.1% | $455,987 | $65,250 | $945 | 0.0210 |
| 18 | Stevensville | 2,130 | 3.5% | $614,348 | $60,096 | $1,064 | 0.0085 |
| 19 | Livingston | 8,780 | 1.9% | $531,830 | $65,861 | $1,046 | 0.0198 |
| 20 | Billings | 119,434 | 3.5% | $392,208 | $73,712 | $1,138 | 0.0392 |
| 21 | Great Falls | 60,329 | 3.7% | $334,707 | $63,373 | $900 | 0.0401 |
| 22 | Columbia Falls | 5,615 | 5.6% | $599,165 | $75,766 | $1,016 | 0.0194 |
| 23 | Havre | 9,258 | 2.9% | $232,554 | $50,329 | $844 | 0.0390 |
| 24 | Hardin | 3,742 | 5.6% | $213,956 | $60,423 | $771 | 0.0083 |
| 25 | Conrad | 2,618 | 4.3% | $252,615 | $47,857 | $918 | 0.0092 |
| 26 | Libby | 3,042 | 3.4% | $346,685 | $34,143 | $672 | 0.0099 |
| 27 | Glendive | 4,810 | 4.3% | $192,739 | $72,670 | $842 | 0.0158 |
| 28 | Wolf Point | 2,602 | 17.4% | $141,601 | $52,868 | $734 | 0.0092 |
| 29 | Cut Bank | 3,028 | 3.5% | $178,057 | $49,432 | $988 | 0.0565 |
| 30 | Shelby | 3,216 | 3.7% | $179,083 | $58,413 | $893 | 0.0308 |
| 31 | Lewistown | 6,087 | 7.0% | $296,569 | $48,750 | $1,007 | 0.0189 |
| 32 | Ronan | 2,001 | 4.9% | $427,544 | $42,298 | $880 | 0.0839 |
| 33 | Roundup | 2,003 | 10.7% | $240,341 | $57,847 | $950 | 0.0308 |
| 34 | Polson | 5,428 | 7.9% | $560,670 | $53,418 | $912 | 0.0437 |
jQuery(document).ready(function($) { create_map(‘https://www.homesnacks.com/graphs/maps/best/mt.html’); });