Great Falls SnackAbility
Overall SnackAbility
Crime in Great Falls summary. We use data from the FBI to determine the crime rates in Great Falls. Key points include:
There were 2,417 total crimes in Great Falls in the last reporting year.
The overall crime rate per 100,000 people in Great Falls is 4,000.7 / 100k people.
The violent crime rate per 100,000 people in Great Falls is 574.4 / 100k people.
The property crime rate per 100,000 people in Great Falls is 3,426.4 / 100k people.
Overall, crime in Great Falls is 88.78% above the national average.
Total Crimes
Above National Average
Crime In Great Falls Comparison Table
| Statistic | Count Raw |
Great Falls / 100k People |
Montana / 100k People |
National / 100k People |
|---|---|---|---|---|
| Total Crimes Per 100K | 2,417 | 4,000.7 | 2,040.7 | 2,119.2 |
| Violent Crime | 347 | 574.4 | 423.5 | 359.0 |
| Murder | 0 | 0.0 | 2.7 | 5.0 |
| Robbery | 28 | 46.3 | 19.1 | 61.0 |
| Aggravated Assault | 265 | 438.6 | 342.5 | 256.0 |
| Property Crime | 2,070 | 3,426.4 | 1,617.3 | 1,760.0 |
| Burglary | 240 | 397.3 | 167.2 | 229.0 |
| Larceny | 1,698 | 2,810.6 | 1,286.0 | 1,272.0 |
| Car Theft | 132 | 218.5 | 164.0 | 259.0 |
Source: FBI Uniform Crime Reporting (2024)
Cost of living in Great Falls summary. We use data on the cost of living to determine how expensive it is to live in Great Falls. Real estate prices drive most of the variance in cost of living around Montana. Key points include:
The cost of living in Great Falls is 98 with 100 being average.
The cost of living in Great Falls is 1.0x lower than the national average.
The median home value in Great Falls is $334,707.
The median income in Great Falls is $63,373.
Great Falls's Overall Cost Of Living
Lower Than The National Average
Cost Of Living In Great Falls Comparison Table
| Living Expense | Great Falls | Montana | National Average |
|---|---|---|---|
| Overall | 98 | 102 | 100 |
| Services | 105 | 104 | 100 |
| Groceries | 103 | 103 | 100 |
| Health | 94 | 101 | 100 |
| Housing | 102 | 99 | 100 |
| Transportation | 104 | 105 | 100 |
| Utilities | 103 | 100 | 100 |
Source: Cost of living index, normalized to US average = 100
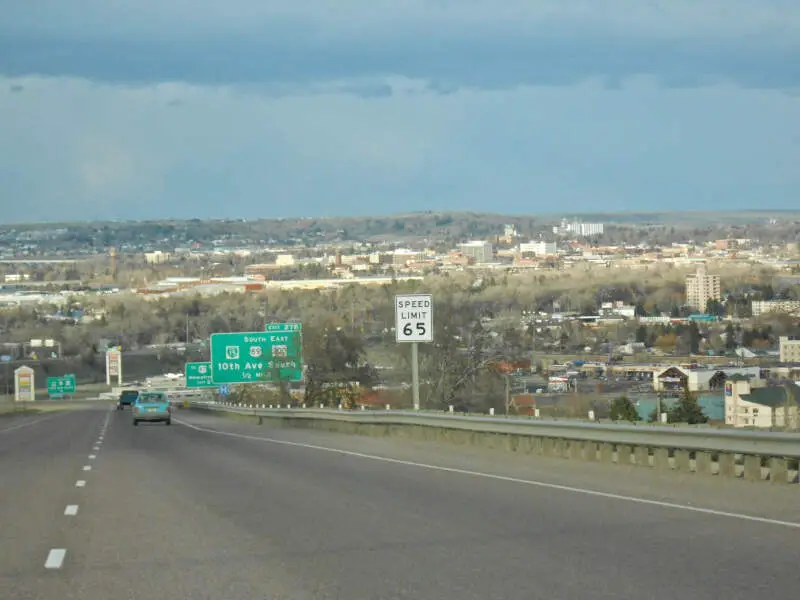
Great Falls, MT Weather
The average high in Great Falls is 58.1° and the average low is 33.2°.
There are 39.5 days of precipitation each year.
Expect an average of 14.2 inches of precipitation each year with 61.2 inches of snow.
| Stat | Great Falls |
|---|---|
| Average Annual High | 58.1 |
| Average Annual Low | 33.2 |
| Annual Precipitation Days | 39.5 |
| Average Annual Precipitation | 14.2 |
| Average Annual Snowfall | 61.2 |
Average High
Days of Rain
Source: NOAA climate normals (30-year)
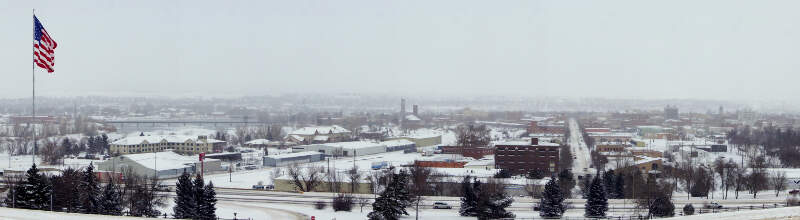
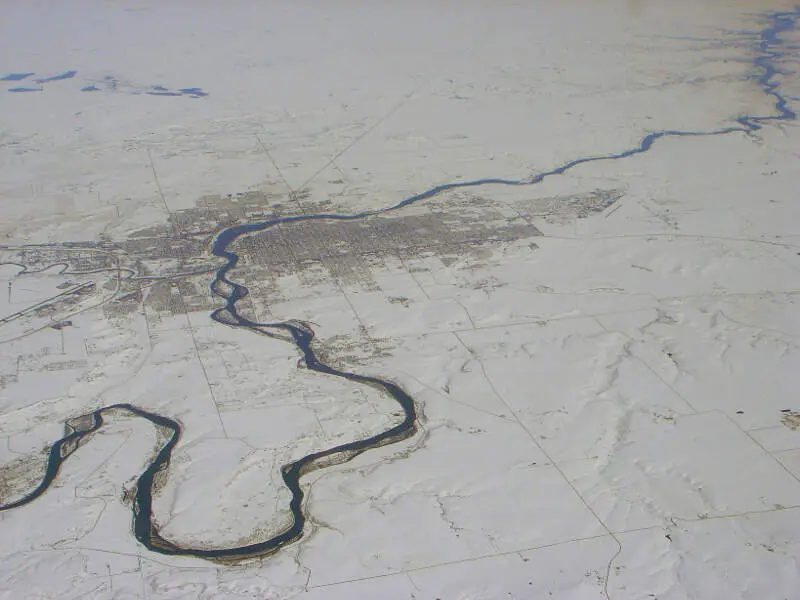
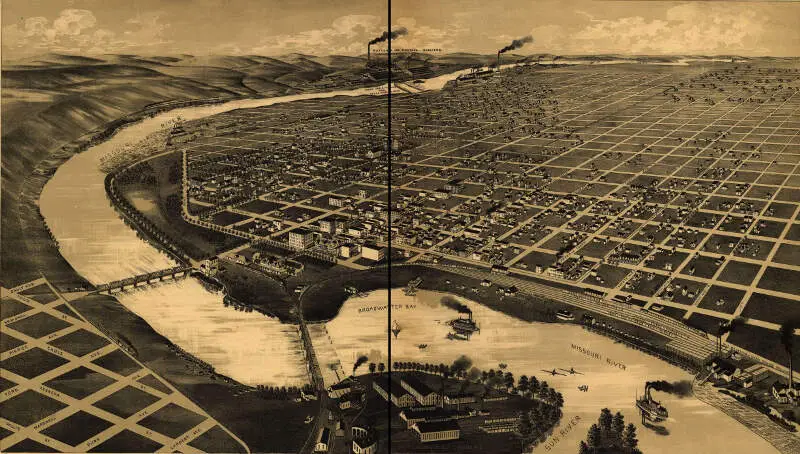
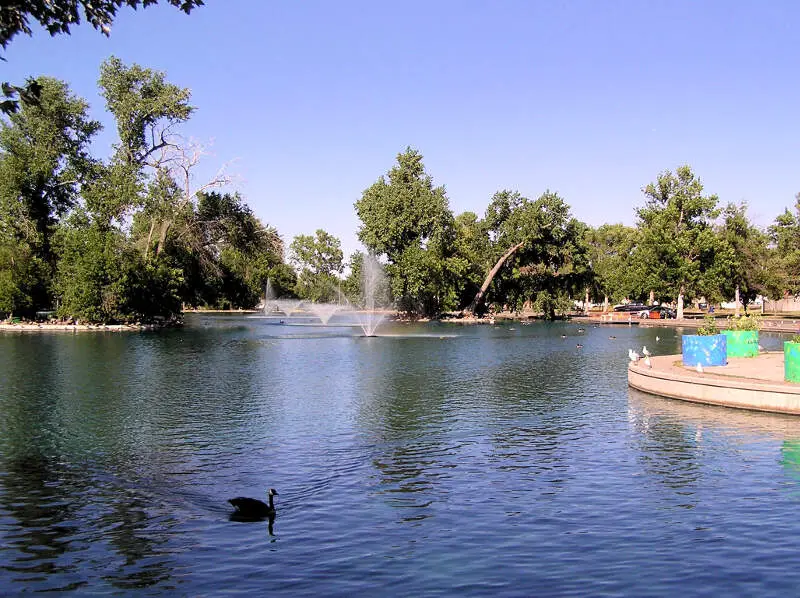
Great Falls, MT Photos
2 Reviews & Comments About Great Falls

One of my sisters and her family live in Great Falls and I have cousins in Montana as well. I've been there in the summer and the winter and have loved both. I grew up in Minnesota, lived in Massachusetts, and now live in Pennsylvania. Montana is my dream. I get there every few years and next year am taking my wife, who has never been there. I may never get to live there but when I die my ashes will be spread in the mountains there!
"My family have lived in Montana since the about 1880. Uncle Charlie Babcock came here as an Indian trader. not that he traded Indians, but then maybe he did. After uncle Charlie came his nephew Albert Stevenson who founded the town of Lodge Grass, where I grew up. Montana has the big sky and lots of open space. On can ride horseback for miles and never see anyone, just like when this earth was created. One can stop and go skinny dipping in the Little Bighorn just for the fun of it. It hasn't changed since Custer lost his battle with the Indians.
We live in Great Falls now and enjoy fishing and canoeing on the Mighty Missouri.
Rankings & Articles For Great Falls


Locations Around Great Falls
Map Of Great Falls, MT
Best Places Around Great Falls
Great Falls Demographics And Statistics
Population over time in Great Falls
The current population in Great Falls is 60,329. The population has increased 4.2% from 2010.
| Year | Population | % Change |
|---|---|---|
| 2024 | 60,329 | -0.1% |
| 2023 | 60,412 | 0.1% |
| 2022 | 60,373 | -0.0% |
| 2021 | 60,381 | 2.8% |
| 2020 | 58,717 | -0.2% |
| 2019 | 58,835 | -0.3% |
| 2018 | 58,990 | -0.3% |
| 2017 | 59,144 | -0.6% |
| 2016 | 59,479 | -0.1% |
| 2015 | 59,563 | 0.9% |
| 2014 | 59,017 | 0.4% |
| 2013 | 58,811 | 0.5% |
| 2012 | 58,498 | 0.5% |
| 2011 | 58,207 | 0.6% |
| 2010 | 57,873 | - |
Race / Ethnicity in Great Falls
See the full breakdown
Great Falls is:
82.3% White with 49,670 White residents.
1.0% African American with 590 African American residents.
3.7% American Indian with 2,258 American Indian residents.
1.0% Asian with 607 Asian residents.
0.0% Hawaiian with 0 Hawaiian residents.
0.8% Other with 475 Other residents.
6.0% Two Or More with 3,645 Two Or More residents.
5.1% Hispanic with 3,084 Hispanic residents.
| Race | Great Falls | MT | USA |
|---|---|---|---|
| White | 82.3% | 83.6% | 57.4% |
| African American | 1.0% | 0.4% | 11.9% |
| American Indian | 3.7% | 5.3% | 0.5% |
| Asian | 1.0% | 0.8% | 5.9% |
| Hawaiian | 0.0% | 0.0% | 0.2% |
| Other | 0.8% | 0.5% | 0.6% |
| Two Or More | 6.0% | 4.7% | 4.3% |
| Hispanic | 5.1% | 4.6% | 19.3% |
Gender in Great Falls
See the full breakdown
Great Falls is 50.3% female with 30,322 female residents.
Great Falls is 49.7% male with 30,006 male residents.
| Gender | Great Falls | MT | USA |
|---|---|---|---|
| Female | 50.3% | 49.3% | 50.5% |
| Male | 49.7% | 50.7% | 49.5% |
Highest level of educational attainment in Great Falls for adults over 25
See the full breakdown
1.0% of adults in Great Falls completed < 9th grade.
4.0% of adults in Great Falls completed 9-12th grade.
33.0% of adults in Great Falls completed high school / ged.
23.0% of adults in Great Falls completed some college.
11.0% of adults in Great Falls completed associate's degree.
17.0% of adults in Great Falls completed bachelor's degree.
8.0% of adults in Great Falls completed master's degree.
2.0% of adults in Great Falls completed professional degree.
1.0% of adults in Great Falls completed doctorate degree.
| Education | Great Falls | MT | USA |
|---|---|---|---|
| < 9th Grade | 1.0% | 1.0% | 4.0% |
| 9-12th Grade | 4.0% | 4.0% | 6.0% |
| High School / GED | 33.0% | 28.0% | 26.0% |
| Some College | 23.0% | 22.0% | 19.0% |
| Associate's Degree | 11.0% | 10.0% | 9.0% |
| Bachelor's Degree | 17.0% | 23.0% | 22.0% |
| Master's Degree | 8.0% | 8.0% | 10.0% |
| Professional Degree | 2.0% | 2.0% | 2.0% |
| Doctorate Degree | 1.0% | 2.0% | 2.0% |
Household Income For Great Falls, Montana
See the full breakdown
4.6% of households in Great Falls earn Less than $10,000.
5.5% of households in Great Falls earn $10,000 to $14,999.
7.4% of households in Great Falls earn $15,000 to $24,999.
8.5% of households in Great Falls earn $25,000 to $34,999.
13.5% of households in Great Falls earn $35,000 to $49,999.
17.4% of households in Great Falls earn $50,000 to $74,999.
15.1% of households in Great Falls earn $75,000 to $99,999.
15.3% of households in Great Falls earn $100,000 to $149,999.
6.5% of households in Great Falls earn $150,000 to $199,999.
6.1% of households in Great Falls earn $200,000 or more.
| Income | Great Falls | MT | USA |
|---|---|---|---|
| Less than $10,000 | 4.6% | 4.2% | 5.0% |
| $10,000 to $14,999 | 5.5% | 3.7% | 3.4% |
| $15,000 to $24,999 | 7.4% | 7.0% | 6.3% |
| $25,000 to $34,999 | 8.5% | 7.6% | 6.6% |
| $35,000 to $49,999 | 13.5% | 11.8% | 10.1% |
| $50,000 to $74,999 | 17.4% | 17.3% | 15.5% |
| $75,000 to $99,999 | 15.1% | 13.6% | 12.6% |
| $100,000 to $149,999 | 15.3% | 17.4% | 17.5% |
| $150,000 to $199,999 | 6.5% | 8.2% | 9.6% |
| $200,000 or more | 6.1% | 9.0% | 13.4% |
Source: U.S. Census ACS 5-year estimates (2024)


