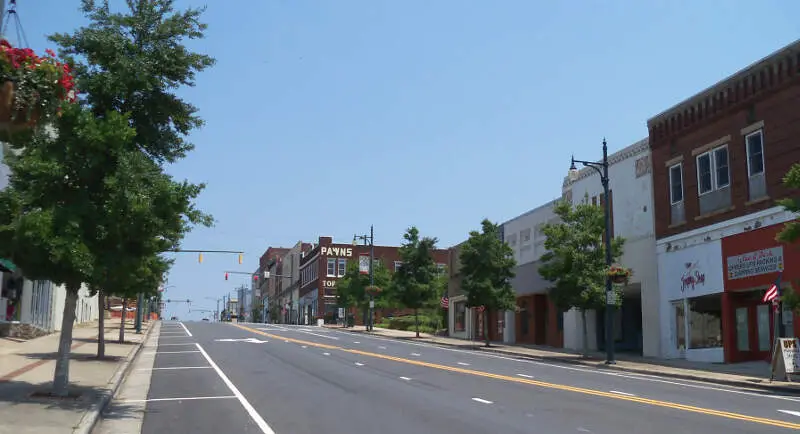
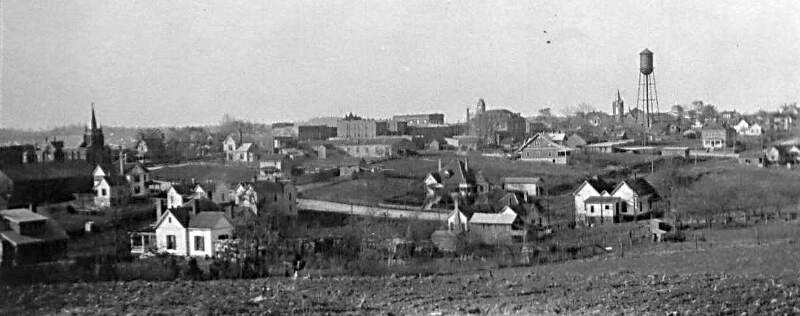
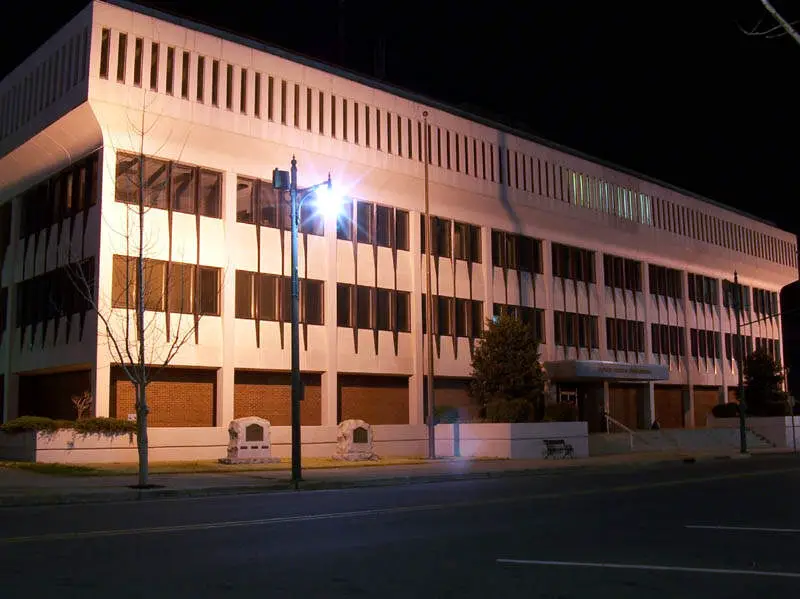
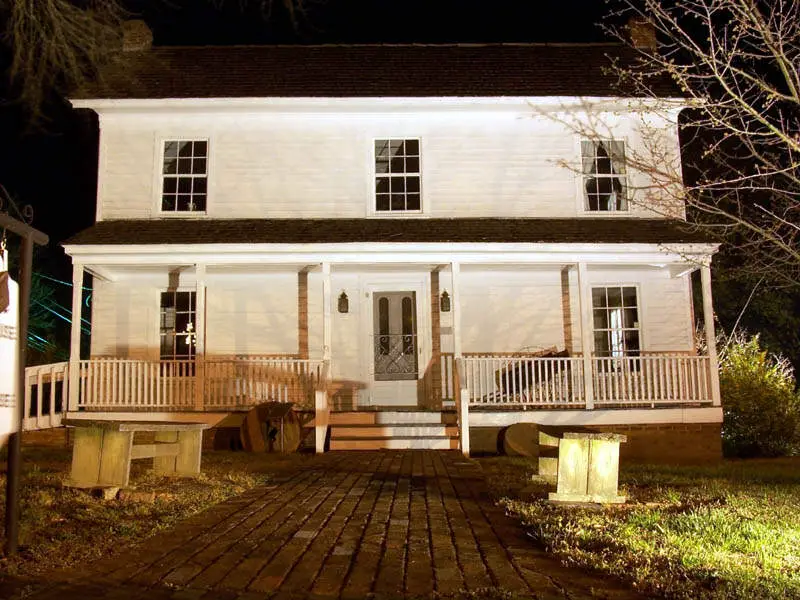
Albemarle, NC
Demographics And Statistics
Living In Albemarle, North Carolina Summary
Life in Albemarle research summary. HomeSnacks has been using Saturday Night Science to research the quality of life in Albemarle over the past nine years using Census, FBI, Zillow, and other primary data sources. Based on the most recently available data, we found the following about life in Albemarle:
The population in Albemarle is 16,527.
The median home value in Albemarle is $254,393.
The median income in Albemarle is $52,825.
The cost of living in Albemarle is 90 which is 0.9x lower than the national average.
The median rent in Albemarle is $856.
The unemployment rate in Albemarle is 5.2%.
The poverty rate in Albemarle is 22.5%.
The average high in Albemarle is 72.4° and the average low is 48.5°.
Albemarle SnackAbility
Overall SnackAbility
Albemarle, NC Crime Report
Crime in Albemarle summary. We use data from the FBI to determine the crime rates in Albemarle. Key points include:
There were 681 total crimes in Albemarle in the last reporting year.
The overall crime rate per 100,000 people in Albemarle is 4,023.4 / 100k people.
The violent crime rate per 100,000 people in Albemarle is 573.1 / 100k people.
The property crime rate per 100,000 people in Albemarle is 3,450.3 / 100k people.
Overall, crime in Albemarle is 89.85% above the national average.
Total Crimes
Above National Average
Crime In Albemarle Comparison Table
| Statistic | Count Raw |
Albemarle / 100k People |
North Carolina / 100k People |
National / 100k People |
|---|---|---|---|---|
| Total Crimes Per 100K | 681 | 4,023.4 | 2,343.9 | 2,119.2 |
| Violent Crime | 97 | 573.1 | 375.8 | 359.0 |
| Murder | 1 | 5.9 | 7.5 | 5.0 |
| Robbery | 2 | 11.8 | 50.2 | 61.0 |
| Aggravated Assault | 90 | 531.7 | 290.1 | 256.0 |
| Property Crime | 584 | 3,450.3 | 1,968.1 | 1,760.0 |
| Burglary | 110 | 649.9 | 323.9 | 229.0 |
| Larceny | 450 | 2,658.6 | 1,390.2 | 1,272.0 |
| Car Theft | 24 | 141.8 | 254.1 | 259.0 |
Albemarle, NC Cost Of Living
Cost of living in Albemarle summary. We use data on the cost of living to determine how expensive it is to live in Albemarle. Real estate prices drive most of the variance in cost of living around North Carolina. Key points include:
The cost of living in Albemarle is 90 with 100 being average.
The cost of living in Albemarle is 0.9x lower than the national average.
The median home value in Albemarle is $254,393.
The median income in Albemarle is $52,825.
Albemarle's Overall Cost Of Living
Lower Than The National Average
Cost Of Living In Albemarle Comparison Table
| Living Expense | Albemarle | North Carolina | National Average | |
|---|---|---|---|---|
| Overall | 90 | 92 | 100 | |
| Services | 93 | 100 | 100 | |
| Groceries | 95 | 99 | 100 | |
| Health | 96 | 106 | 100 | |
| Housing | 71 | 86 | 100 | |
| Transportation | 102 | 93 | 100 | |
| Utilities | 102 | 95 | 100 | |
Albemarle, NC Weather
The average high in Albemarle is 72.4° and the average low is 48.5°.
There are 70.6 days of precipitation each year.
Expect an average of 46.5 inches of precipitation each year with 2.5 inches of snow.
| Stat | Albemarle |
|---|---|
| Average Annual High | 72.4 |
| Average Annual Low | 48.5 |
| Annual Precipitation Days | 70.6 |
| Average Annual Precipitation | 46.5 |
| Average Annual Snowfall | 2.5 |
Average High
Days of Rain
Albemarle, NC Photos

Rankings for Albemarle in North Carolina


Locations Around Albemarle
Map Of Albemarle, NC
Best Places Around Albemarle
Matthews, NC
Population 29,959
Davidson, NC
Population 14,852
Cornelius, NC
Population 32,009
Harrisburg, NC
Population 19,203
Clemmons, NC
Population 21,574
Marvin, NC
Population 6,542
Stallings, NC
Population 16,495
Indian Trail, NC
Population 41,146
Wesley Chapel, NC
Population 8,923
Weddington, NC
Population 13,468
Albemarle Demographics And Statistics
Population over time in Albemarle
The current population in Albemarle is 16,527. The population has increased 3.9% from 2010.
| Year | Population | % Change |
|---|---|---|
| 2023 | 16,527 | 0.5% |
| 2022 | 16,444 | 0.8% |
| 2021 | 16,318 | 1.5% |
| 2020 | 16,073 | 0.6% |
| 2019 | 15,980 | 0.6% |
| 2018 | 15,889 | 0.1% |
| 2017 | 15,874 | -0.6% |
| 2016 | 15,968 | -0.0% |
| 2015 | 15,969 | 0.3% |
| 2014 | 15,924 | -0.1% |
| 2013 | 15,937 | 0.2% |
| 2012 | 15,913 | -0.0% |
| 2011 | 15,919 | 0.0% |
| 2010 | 15,912 | - |
Race / Ethnicity in Albemarle
Albemarle is:
63.0% White with 10,406 White residents.
22.3% African American with 3,686 African American residents.
0.0% American Indian with 0 American Indian residents.
3.8% Asian with 622 Asian residents.
1.1% Hawaiian with 184 Hawaiian residents.
0.0% Other with 0 Other residents.
1.7% Two Or More with 280 Two Or More residents.
8.2% Hispanic with 1,349 Hispanic residents.
| Race | Albemarle | NC | USA |
|---|---|---|---|
| White | 63.0% | 60.6% | 58.2% |
| African American | 22.3% | 20.3% | 12.0% |
| American Indian | 0.0% | 0.8% | 0.5% |
| Asian | 3.8% | 3.1% | 5.7% |
| Hawaiian | 1.1% | 0.1% | 0.2% |
| Other | 0.0% | 0.4% | 0.5% |
| Two Or More | 1.7% | 3.7% | 3.9% |
| Hispanic | 8.2% | 10.9% | 19.0% |
Gender in Albemarle
Albemarle is 52.0% female with 8,596 female residents.
Albemarle is 48.0% male with 7,931 male residents.
| Gender | Albemarle | NC | USA |
|---|---|---|---|
| Female | 52.0% | 51.1% | 50.5% |
| Male | 48.0% | 48.9% | 49.5% |
Highest level of educational attainment in Albemarle for adults over 25
3.0% of adults in Albemarle completed < 9th grade.
9.0% of adults in Albemarle completed 9-12th grade.
31.0% of adults in Albemarle completed high school / ged.
22.0% of adults in Albemarle completed some college.
13.0% of adults in Albemarle completed associate's degree.
18.0% of adults in Albemarle completed bachelor's degree.
3.0% of adults in Albemarle completed master's degree.
1.0% of adults in Albemarle completed professional degree.
0.0% of adults in Albemarle completed doctorate degree.
| Education | Albemarle | NC | USA |
|---|---|---|---|
| < 9th Grade | 3.0% | 4.0% | 5.0% |
| 9-12th Grade | 9.0% | 6.0% | 6.0% |
| High School / GED | 31.0% | 25.0% | 26.0% |
| Some College | 22.0% | 20.0% | 19.0% |
| Associate's Degree | 13.0% | 10.0% | 9.0% |
| Bachelor's Degree | 18.0% | 22.0% | 21.0% |
| Master's Degree | 3.0% | 9.0% | 10.0% |
| Professional Degree | 1.0% | 2.0% | 2.0% |
| Doctorate Degree | 0.0% | 2.0% | 2.0% |
Household Income For Albemarle, North Carolina
9.4% of households in Albemarle earn Less than $10,000.
5.9% of households in Albemarle earn $10,000 to $14,999.
12.7% of households in Albemarle earn $15,000 to $24,999.
10.7% of households in Albemarle earn $25,000 to $34,999.
8.5% of households in Albemarle earn $35,000 to $49,999.
18.1% of households in Albemarle earn $50,000 to $74,999.
12.4% of households in Albemarle earn $75,000 to $99,999.
13.1% of households in Albemarle earn $100,000 to $149,999.
5.9% of households in Albemarle earn $150,000 to $199,999.
3.3% of households in Albemarle earn $200,000 or more.
| Income | Albemarle | NC | USA |
|---|---|---|---|
| Less than $10,000 | 9.4% | 5.0% | 4.9% |
| $10,000 to $14,999 | 5.9% | 3.9% | 3.6% |
| $15,000 to $24,999 | 12.7% | 7.6% | 6.6% |
| $25,000 to $34,999 | 10.7% | 7.8% | 6.8% |
| $35,000 to $49,999 | 8.5% | 12.0% | 10.4% |
| $50,000 to $74,999 | 18.1% | 17.0% | 15.7% |
| $75,000 to $99,999 | 12.4% | 13.0% | 12.7% |
| $100,000 to $149,999 | 13.1% | 16.5% | 17.4% |
| $150,000 to $199,999 | 5.9% | 7.8% | 9.3% |
| $200,000 or more | 3.3% | 9.5% | 12.6% |


