Concord SnackAbility
Overall SnackAbility
Crime in Concord summary. We use data from the FBI to determine the crime rates in Concord. Key points include:
There were 1,415 total crimes in Concord in the last reporting year.
The overall crime rate per 100,000 people in Concord is 1,264.3 / 100k people.
The violent crime rate per 100,000 people in Concord is 159.0 / 100k people.
The property crime rate per 100,000 people in Concord is 1,105.2 / 100k people.
Overall, crime in Concord is -40.34% below the national average.
Total Crimes
Below National Average
Crime In Concord Comparison Table
| Statistic | Count Raw |
Concord / 100k People |
North Carolina / 100k People |
National / 100k People |
|---|---|---|---|---|
| Total Crimes Per 100K | 1,415 | 1,264.3 | 2,343.9 | 2,119.2 |
| Violent Crime | 178 | 159.0 | 375.8 | 359.0 |
| Murder | 6 | 5.4 | 7.5 | 5.0 |
| Robbery | 28 | 25.0 | 50.2 | 61.0 |
| Aggravated Assault | 132 | 117.9 | 290.1 | 256.0 |
| Property Crime | 1,237 | 1,105.2 | 1,968.1 | 1,760.0 |
| Burglary | 127 | 113.5 | 323.9 | 229.0 |
| Larceny | 923 | 824.7 | 1,390.2 | 1,272.0 |
| Car Theft | 187 | 167.1 | 254.1 | 259.0 |
Source: FBI Uniform Crime Reporting (2024)
Cost of living in Concord summary. We use data on the cost of living to determine how expensive it is to live in Concord. Real estate prices drive most of the variance in cost of living around North Carolina. Key points include:
The cost of living in Concord is 104 with 100 being average.
The cost of living in Concord is 1.0x higher than the national average.
The median home value in Concord is $382,592.
The median income in Concord is $86,921.
Concord's Overall Cost Of Living
Higher Than The National Average
Cost Of Living In Concord Comparison Table
| Living Expense | Concord | North Carolina | National Average |
|---|---|---|---|
| Overall | 104 | 95 | 100 |
| Services | 99 | 98 | 100 |
| Groceries | 102 | 98 | 100 |
| Health | 115 | 89 | 100 |
| Housing | 98 | 100 | 100 |
| Transportation | 96 | 97 | 100 |
| Utilities | 100 | 101 | 100 |
Source: Cost of living index, normalized to US average = 100
Concord, NC Weather
The average high in Concord is 71.6° and the average low is 48.6°.
There are 72.0 days of precipitation each year.
Expect an average of 45.0 inches of precipitation each year with 3.7 inches of snow.
| Stat | Concord |
|---|---|
| Average Annual High | 71.6 |
| Average Annual Low | 48.6 |
| Annual Precipitation Days | 72.0 |
| Average Annual Precipitation | 45.0 |
| Average Annual Snowfall | 3.7 |
Average High
Days of Rain
Source: NOAA climate normals (30-year)
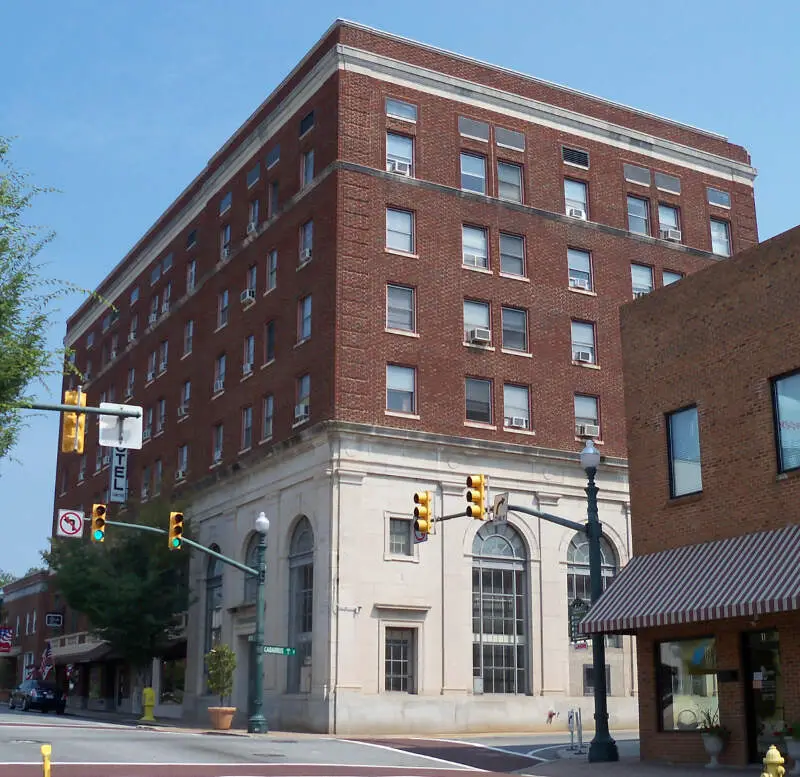
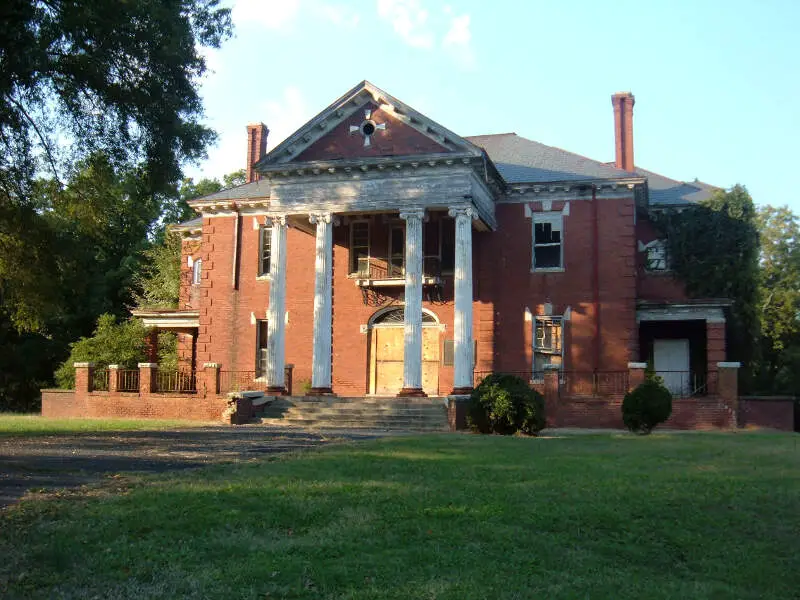
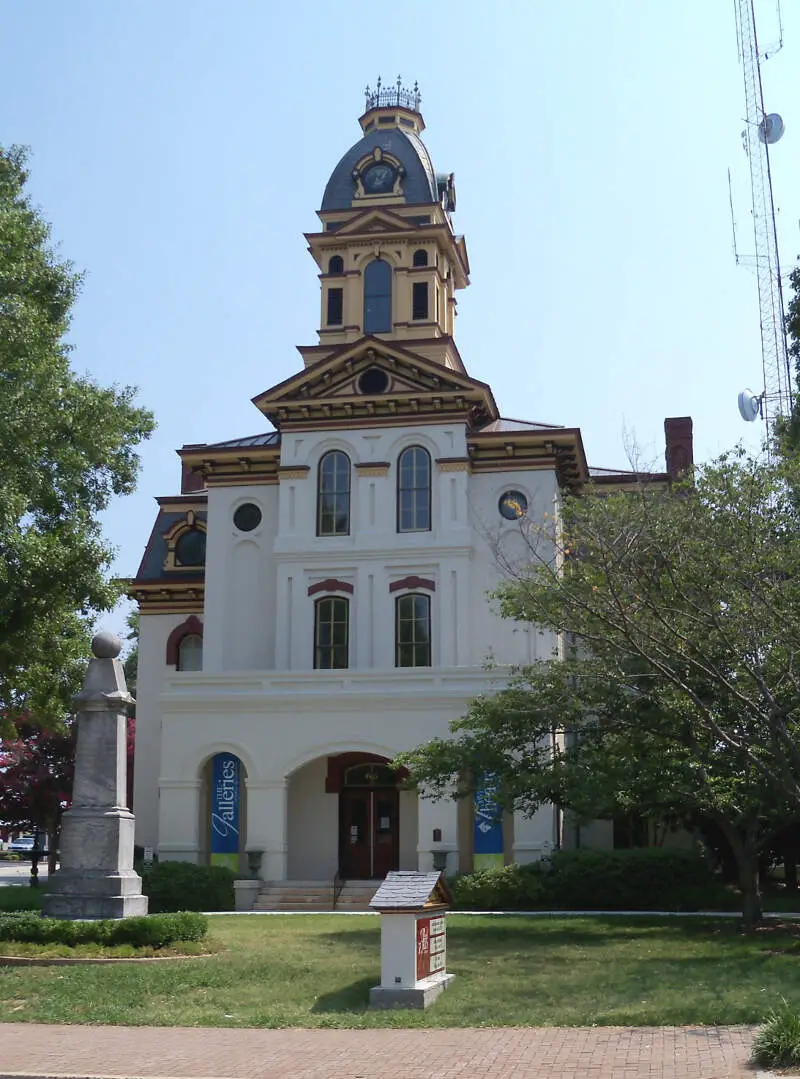
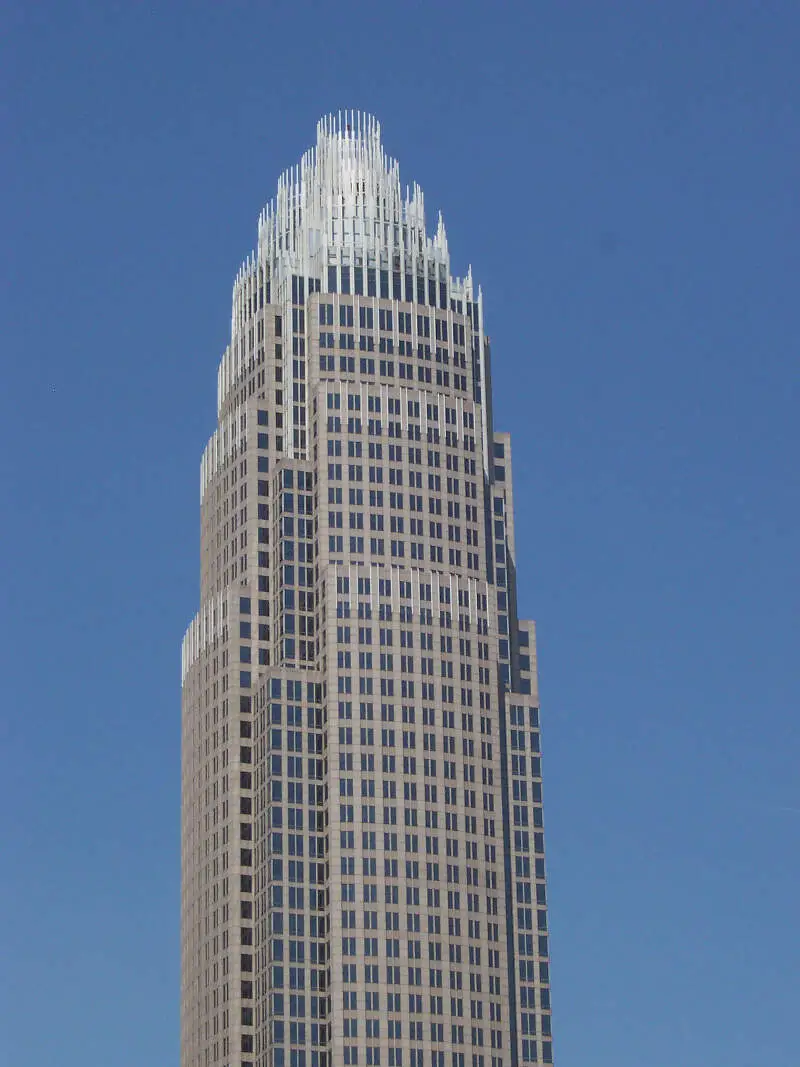
Concord, NC Photos


Rankings & Articles For Concord


Locations Around Concord
Map Of Concord, NC
Best Places Around Concord
Matthews, NC
Population 30,577
Davidson, NC
Population 15,660
Cornelius, NC
Population 32,783
Harrisburg, NC
Population 19,633
Stallings, NC
Population 16,886
Huntersville, NC
Population 63,969
Charlotte, NC
Population 903,844
Mint Hill, NC
Population 27,556
Kannapolis, NC
Population 57,890
Mooresville, NC
Population 52,381
Concord Demographics And Statistics
Population over time in Concord
The current population in Concord is 108,719. The population has increased 44.6% from 2010.
| Year | Population | % Change |
|---|---|---|
| 2024 | 108,719 | 2.1% |
| 2023 | 106,518 | 1.1% |
| 2022 | 105,335 | 2.7% |
| 2021 | 102,566 | 8.9% |
| 2020 | 94,147 | 2.4% |
| 2019 | 91,980 | 2.5% |
| 2018 | 89,729 | 2.4% |
| 2017 | 87,607 | 2.2% |
| 2016 | 85,753 | 2.2% |
| 2015 | 83,903 | 2.0% |
| 2014 | 82,266 | 1.9% |
| 2013 | 80,715 | 2.0% |
| 2012 | 79,171 | 2.3% |
| 2011 | 77,413 | 3.0% |
| 2010 | 75,172 | - |
Race / Ethnicity in Concord
See the full breakdown
Concord is:
49.4% White with 53,709 White residents.
22.3% African American with 24,234 African American residents.
0.0% American Indian with 34 American Indian residents.
7.7% Asian with 8,381 Asian residents.
0.0% Hawaiian with 11 Hawaiian residents.
0.8% Other with 819 Other residents.
4.0% Two Or More with 4,382 Two Or More residents.
15.8% Hispanic with 17,149 Hispanic residents.
| Race | Concord | NC | USA |
|---|---|---|---|
| White | 49.4% | 60.0% | 57.4% |
| African American | 22.3% | 20.0% | 11.9% |
| American Indian | 0.0% | 0.8% | 0.5% |
| Asian | 7.7% | 3.3% | 5.9% |
| Hawaiian | 0.0% | 0.1% | 0.2% |
| Other | 0.8% | 0.5% | 0.6% |
| Two Or More | 4.0% | 4.1% | 4.3% |
| Hispanic | 15.8% | 11.3% | 19.3% |
Gender in Concord
See the full breakdown
Concord is 51.0% female with 55,485 female residents.
Concord is 49.0% male with 53,233 male residents.
| Gender | Concord | NC | USA |
|---|---|---|---|
| Female | 51.0% | 51.1% | 50.5% |
| Male | 49.0% | 48.9% | 49.5% |
Highest level of educational attainment in Concord for adults over 25
See the full breakdown
4.0% of adults in Concord completed < 9th grade.
5.0% of adults in Concord completed 9-12th grade.
23.0% of adults in Concord completed high school / ged.
18.0% of adults in Concord completed some college.
9.0% of adults in Concord completed associate's degree.
25.0% of adults in Concord completed bachelor's degree.
13.0% of adults in Concord completed master's degree.
2.0% of adults in Concord completed professional degree.
1.0% of adults in Concord completed doctorate degree.
| Education | Concord | NC | USA |
|---|---|---|---|
| < 9th Grade | 4.0% | 3.0% | 4.0% |
| 9-12th Grade | 5.0% | 6.0% | 6.0% |
| High School / GED | 23.0% | 25.0% | 26.0% |
| Some College | 18.0% | 20.0% | 19.0% |
| Associate's Degree | 9.0% | 10.0% | 9.0% |
| Bachelor's Degree | 25.0% | 22.0% | 22.0% |
| Master's Degree | 13.0% | 10.0% | 10.0% |
| Professional Degree | 2.0% | 2.0% | 2.0% |
| Doctorate Degree | 1.0% | 2.0% | 2.0% |
Household Income For Concord, North Carolina
See the full breakdown
4.2% of households in Concord earn Less than $10,000.
1.8% of households in Concord earn $10,000 to $14,999.
5.9% of households in Concord earn $15,000 to $24,999.
5.9% of households in Concord earn $25,000 to $34,999.
8.3% of households in Concord earn $35,000 to $49,999.
17.0% of households in Concord earn $50,000 to $74,999.
14.6% of households in Concord earn $75,000 to $99,999.
17.0% of households in Concord earn $100,000 to $149,999.
10.6% of households in Concord earn $150,000 to $199,999.
14.6% of households in Concord earn $200,000 or more.
| Income | Concord | NC | USA |
|---|---|---|---|
| Less than $10,000 | 4.2% | 5.0% | 5.0% |
| $10,000 to $14,999 | 1.8% | 3.7% | 3.4% |
| $15,000 to $24,999 | 5.9% | 7.1% | 6.3% |
| $25,000 to $34,999 | 5.9% | 7.4% | 6.6% |
| $35,000 to $49,999 | 8.3% | 11.7% | 10.1% |
| $50,000 to $74,999 | 17.0% | 16.8% | 15.5% |
| $75,000 to $99,999 | 14.6% | 13.0% | 12.6% |
| $100,000 to $149,999 | 17.0% | 16.6% | 17.5% |
| $150,000 to $199,999 | 10.6% | 8.3% | 9.6% |
| $200,000 or more | 14.6% | 10.4% | 13.4% |
Source: U.S. Census ACS 5-year estimates (2024)


