Lenoir SnackAbility
Overall SnackAbility
Crime in Lenoir summary. We use data from the FBI to determine the crime rates in Lenoir. Key points include:
There were 633 total crimes in Lenoir in the last reporting year.
The overall crime rate per 100,000 people in Lenoir is 3,477.8 / 100k people.
The violent crime rate per 100,000 people in Lenoir is 258.2 / 100k people.
The property crime rate per 100,000 people in Lenoir is 3,219.6 / 100k people.
Overall, crime in Lenoir is 64.11% above the national average.
Total Crimes
Above National Average
Crime In Lenoir Comparison Table
| Statistic | Count Raw |
Lenoir / 100k People |
North Carolina / 100k People |
National / 100k People |
|---|---|---|---|---|
| Total Crimes Per 100K | 633 | 3,477.8 | 2,343.9 | 2,119.2 |
| Violent Crime | 47 | 258.2 | 375.8 | 359.0 |
| Murder | 0 | 0.0 | 7.5 | 5.0 |
| Robbery | 9 | 49.4 | 50.2 | 61.0 |
| Aggravated Assault | 29 | 159.3 | 290.1 | 256.0 |
| Property Crime | 586 | 3,219.6 | 1,968.1 | 1,760.0 |
| Burglary | 166 | 912.0 | 323.9 | 229.0 |
| Larceny | 380 | 2,087.8 | 1,390.2 | 1,272.0 |
| Car Theft | 40 | 219.8 | 254.1 | 259.0 |
Source: FBI Uniform Crime Reporting (2024)
Cost of living in Lenoir summary. We use data on the cost of living to determine how expensive it is to live in Lenoir. Real estate prices drive most of the variance in cost of living around North Carolina. Key points include:
The cost of living in Lenoir is 90 with 100 being average.
The cost of living in Lenoir is 0.9x lower than the national average.
The median home value in Lenoir is $215,174.
The median income in Lenoir is $49,910.
Lenoir's Overall Cost Of Living
Lower Than The National Average
Cost Of Living In Lenoir Comparison Table
| Living Expense | Lenoir | North Carolina | National Average |
|---|---|---|---|
| Overall | 90 | 95 | 100 |
| Services | 99 | 98 | 100 |
| Groceries | 100 | 98 | 100 |
| Health | 62 | 89 | 100 |
| Housing | 95 | 100 | 100 |
| Transportation | 99 | 97 | 100 |
| Utilities | 98 | 101 | 100 |
Source: Cost of living index, normalized to US average = 100
Lenoir, NC Weather
The average high in Lenoir is 69.9° and the average low is 46.2°.
There are 105.0 days of precipitation each year.
Expect an average of 48.0 inches of precipitation each year with 4.8 inches of snow.
| Stat | Lenoir |
|---|---|
| Average Annual High | 69.9 |
| Average Annual Low | 46.2 |
| Annual Precipitation Days | 105.0 |
| Average Annual Precipitation | 48.0 |
| Average Annual Snowfall | 4.8 |
Average High
Days of Rain
Source: NOAA climate normals (30-year)
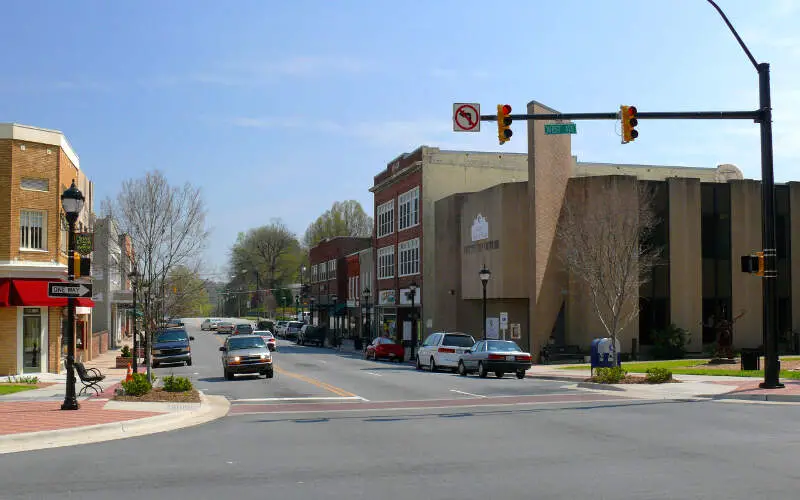
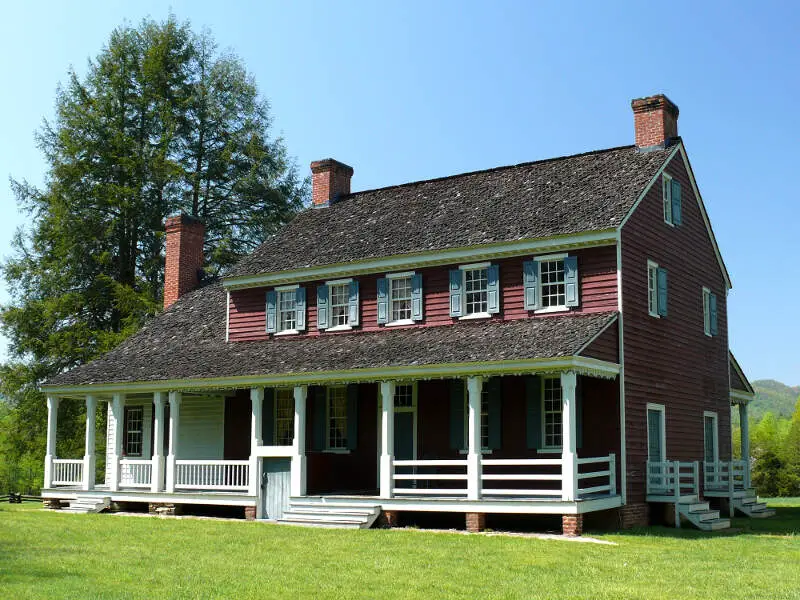
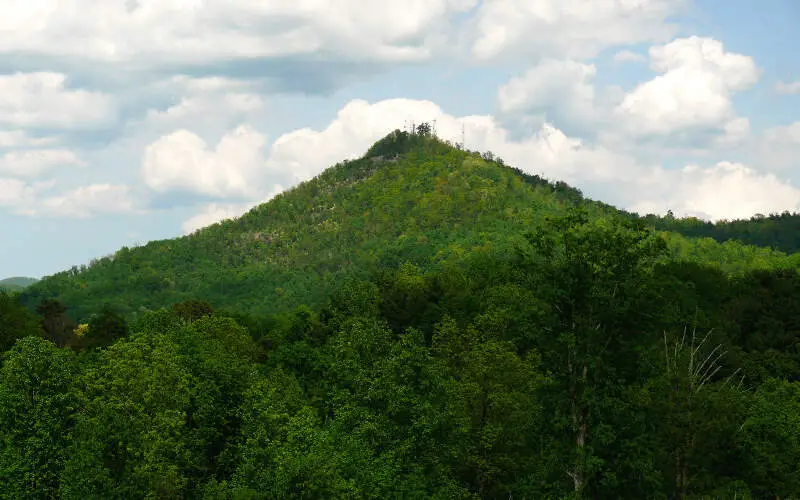
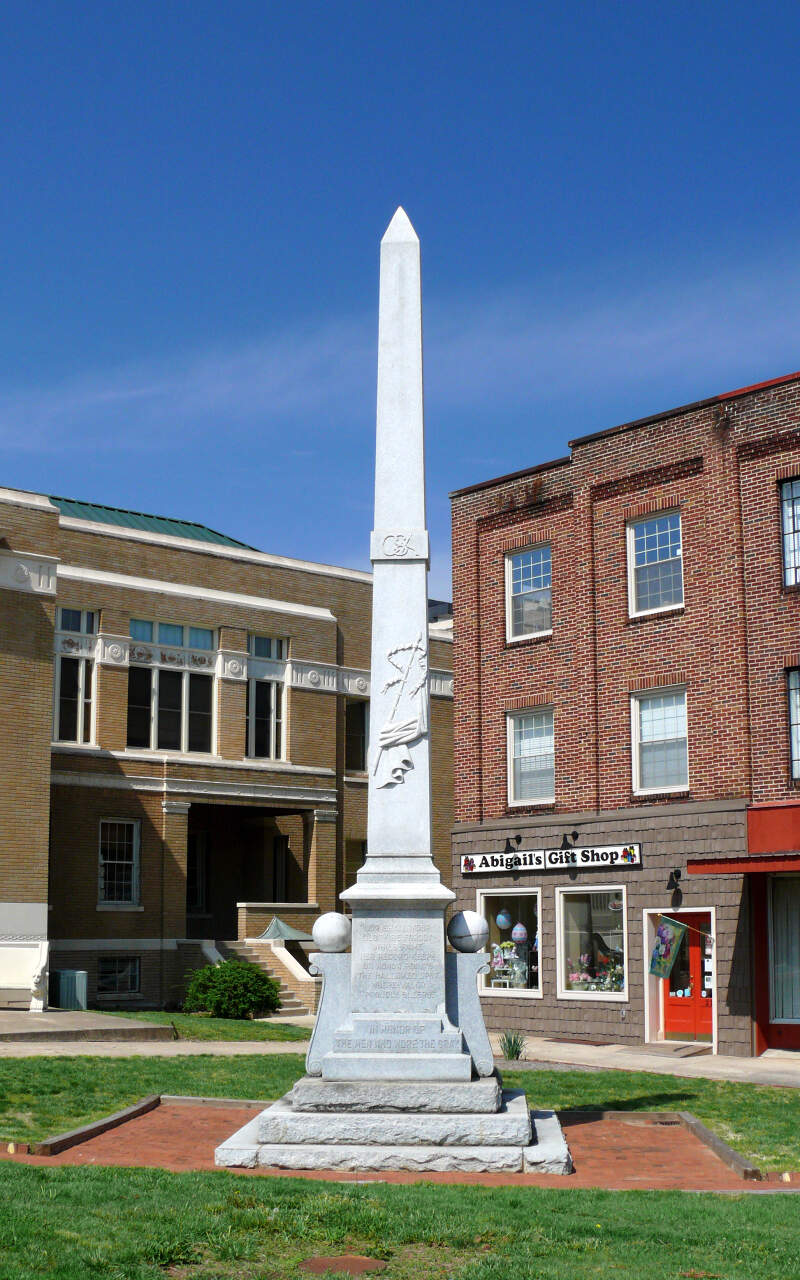
Lenoir, NC Photos
Rankings & Articles For Lenoir


Locations Around Lenoir
Map Of Lenoir, NC
Best Places Around Lenoir
Davidson, NC
Population 15,660
Cornelius, NC
Population 32,783
Boone, NC
Population 20,032
Black Mountain, NC
Population 8,513
Lake Norman of Catawba, NC
Population 9,906
Mooresville, NC
Population 52,381
St. Stephens, NC
Population 9,457
Hickory, NC
Population 44,258
Conover, NC
Population 8,580
Lincolnton, NC
Population 11,783
Lenoir Demographics And Statistics
Population over time in Lenoir
The current population in Lenoir is 18,299. The population has increased 0.4% from 2010.
| Year | Population | % Change |
|---|---|---|
| 2024 | 18,299 | 0.1% |
| 2023 | 18,282 | -0.1% |
| 2022 | 18,301 | 0.5% |
| 2021 | 18,205 | 1.7% |
| 2020 | 17,909 | 0.2% |
| 2019 | 17,879 | -0.1% |
| 2018 | 17,899 | 0.1% |
| 2017 | 17,890 | -0.4% |
| 2016 | 17,956 | -0.1% |
| 2015 | 17,978 | -0.5% |
| 2014 | 18,061 | -0.4% |
| 2013 | 18,126 | -0.2% |
| 2012 | 18,171 | -0.3% |
| 2011 | 18,219 | -0.0% |
| 2010 | 18,225 | - |
Race / Ethnicity in Lenoir
See the full breakdown
Lenoir is:
73.2% White with 13,394 White residents.
10.0% African American with 1,822 African American residents.
0.1% American Indian with 15 American Indian residents.
0.9% Asian with 172 Asian residents.
0.0% Hawaiian with 0 Hawaiian residents.
0.0% Other with 0 Other residents.
2.6% Two Or More with 475 Two Or More residents.
13.2% Hispanic with 2,421 Hispanic residents.
| Race | Lenoir | NC | USA |
|---|---|---|---|
| White | 73.2% | 60.0% | 57.4% |
| African American | 10.0% | 20.0% | 11.9% |
| American Indian | 0.1% | 0.8% | 0.5% |
| Asian | 0.9% | 3.3% | 5.9% |
| Hawaiian | 0.0% | 0.1% | 0.2% |
| Other | 0.0% | 0.5% | 0.6% |
| Two Or More | 2.6% | 4.1% | 4.3% |
| Hispanic | 13.2% | 11.3% | 19.3% |
Gender in Lenoir
See the full breakdown
Lenoir is 54.0% female with 9,874 female residents.
Lenoir is 46.0% male with 8,425 male residents.
| Gender | Lenoir | NC | USA |
|---|---|---|---|
| Female | 54.0% | 51.1% | 50.5% |
| Male | 46.0% | 48.9% | 49.5% |
Highest level of educational attainment in Lenoir for adults over 25
See the full breakdown
4.0% of adults in Lenoir completed < 9th grade.
10.0% of adults in Lenoir completed 9-12th grade.
31.0% of adults in Lenoir completed high school / ged.
23.0% of adults in Lenoir completed some college.
11.0% of adults in Lenoir completed associate's degree.
16.0% of adults in Lenoir completed bachelor's degree.
4.0% of adults in Lenoir completed master's degree.
1.0% of adults in Lenoir completed professional degree.
0.0% of adults in Lenoir completed doctorate degree.
| Education | Lenoir | NC | USA |
|---|---|---|---|
| < 9th Grade | 4.0% | 3.0% | 4.0% |
| 9-12th Grade | 10.0% | 6.0% | 6.0% |
| High School / GED | 31.0% | 25.0% | 26.0% |
| Some College | 23.0% | 20.0% | 19.0% |
| Associate's Degree | 11.0% | 10.0% | 9.0% |
| Bachelor's Degree | 16.0% | 22.0% | 22.0% |
| Master's Degree | 4.0% | 10.0% | 10.0% |
| Professional Degree | 1.0% | 2.0% | 2.0% |
| Doctorate Degree | 0.0% | 2.0% | 2.0% |
Household Income For Lenoir, North Carolina
See the full breakdown
5.9% of households in Lenoir earn Less than $10,000.
8.5% of households in Lenoir earn $10,000 to $14,999.
9.5% of households in Lenoir earn $15,000 to $24,999.
11.4% of households in Lenoir earn $25,000 to $34,999.
14.7% of households in Lenoir earn $35,000 to $49,999.
19.9% of households in Lenoir earn $50,000 to $74,999.
10.9% of households in Lenoir earn $75,000 to $99,999.
10.0% of households in Lenoir earn $100,000 to $149,999.
6.3% of households in Lenoir earn $150,000 to $199,999.
2.8% of households in Lenoir earn $200,000 or more.
| Income | Lenoir | NC | USA |
|---|---|---|---|
| Less than $10,000 | 5.9% | 5.0% | 5.0% |
| $10,000 to $14,999 | 8.5% | 3.7% | 3.4% |
| $15,000 to $24,999 | 9.5% | 7.1% | 6.3% |
| $25,000 to $34,999 | 11.4% | 7.4% | 6.6% |
| $35,000 to $49,999 | 14.7% | 11.7% | 10.1% |
| $50,000 to $74,999 | 19.9% | 16.8% | 15.5% |
| $75,000 to $99,999 | 10.9% | 13.0% | 12.6% |
| $100,000 to $149,999 | 10.0% | 16.6% | 17.5% |
| $150,000 to $199,999 | 6.3% | 8.3% | 9.6% |
| $200,000 or more | 2.8% | 10.4% | 13.4% |
Source: U.S. Census ACS 5-year estimates (2024)


