Nashville SnackAbility
Overall SnackAbility
Cost of living in Nashville summary. We use data on the cost of living to determine how expensive it is to live in Nashville. Real estate prices drive most of the variance in cost of living around North Carolina. Key points include:
The cost of living in Nashville is 95 with 100 being average.
The cost of living in Nashville is 0.9x lower than the national average.
The median home value in Nashville is $257,559.
The median income in Nashville is $61,000.
Nashville's Overall Cost Of Living
Lower Than The National Average
Cost Of Living In Nashville Comparison Table
| Living Expense | Nashville | North Carolina | National Average |
|---|---|---|---|
| Overall | 95 | 95 | 100 |
| Services | 99 | 98 | 100 |
| Groceries | 100 | 98 | 100 |
| Health | 83 | 89 | 100 |
| Housing | 98 | 100 | 100 |
| Transportation | 99 | 97 | 100 |
| Utilities | 98 | 101 | 100 |
Source: Cost of living index, normalized to US average = 100
Nashville, NC Weather
The average high in Nashville is 71.1° and the average low is 48.4°.
There are 75.5 days of precipitation each year.
Expect an average of 44.6 inches of precipitation each year with 1.6 inches of snow.
| Stat | Nashville |
|---|---|
| Average Annual High | 71.1 |
| Average Annual Low | 48.4 |
| Annual Precipitation Days | 75.5 |
| Average Annual Precipitation | 44.6 |
| Average Annual Snowfall | 1.6 |
Average High
Days of Rain
Source: NOAA climate normals (30-year)
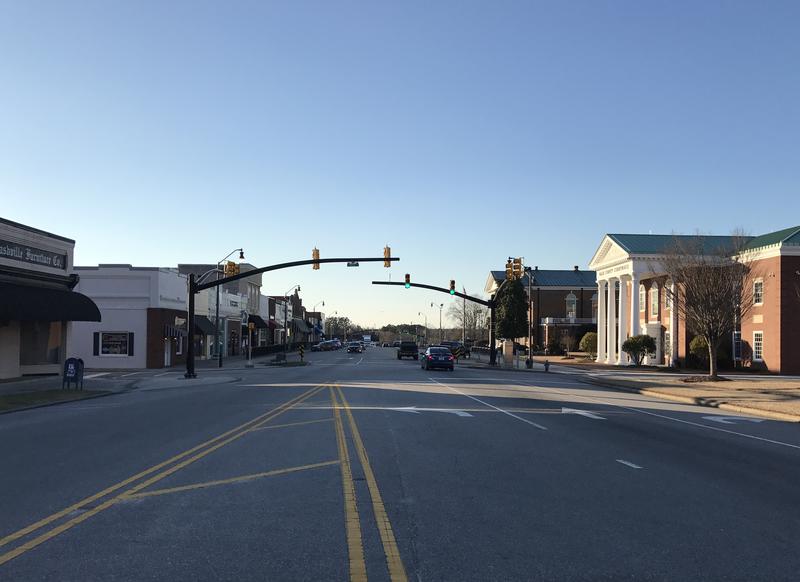
Nashville, NC Photos
Rankings & Articles For Nashville


Locations Around Nashville
Map Of Nashville, NC
Best Places Around Nashville
Cary, NC
Population 179,306
Wake Forest, NC
Population 52,844
Raleigh, NC
Population 481,031
Garner, NC
Population 34,473
Knightdale, NC
Population 20,214
Winterville, NC
Population 10,725
Clayton, NC
Population 29,320
Wendell, NC
Population 13,064
Greenville, NC
Population 92,857
Roanoke Rapids, NC
Population 14,856
Nashville Demographics And Statistics
Population over time in Nashville
The current population in Nashville is 5,729. The population has increased 10.0% from 2010.
| Year | Population | % Change |
|---|---|---|
| 2024 | 5,729 | 1.0% |
| 2023 | 5,672 | 0.9% |
| 2022 | 5,624 | -0.0% |
| 2021 | 5,626 | 1.9% |
| 2020 | 5,521 | 0.1% |
| 2019 | 5,516 | -0.1% |
| 2018 | 5,523 | 0.9% |
| 2017 | 5,473 | -0.9% |
| 2016 | 5,521 | 1.1% |
| 2015 | 5,459 | -0.2% |
| 2014 | 5,469 | 0.4% |
| 2013 | 5,446 | 2.4% |
| 2012 | 5,319 | 0.9% |
| 2011 | 5,272 | 1.2% |
| 2010 | 5,210 | - |
Race / Ethnicity in Nashville
See the full breakdown
Nashville is:
38.2% White with 2,188 White residents.
59.9% African American with 3,430 African American residents.
0.0% American Indian with 0 American Indian residents.
0.5% Asian with 27 Asian residents.
0.0% Hawaiian with 0 Hawaiian residents.
0.0% Other with 0 Other residents.
1.3% Two Or More with 77 Two Or More residents.
0.1% Hispanic with 7 Hispanic residents.
| Race | Nashville | NC | USA |
|---|---|---|---|
| White | 38.2% | 60.0% | 57.4% |
| African American | 59.9% | 20.0% | 11.9% |
| American Indian | 0.0% | 0.8% | 0.5% |
| Asian | 0.5% | 3.3% | 5.9% |
| Hawaiian | 0.0% | 0.1% | 0.2% |
| Other | 0.0% | 0.5% | 0.6% |
| Two Or More | 1.3% | 4.1% | 4.3% |
| Hispanic | 0.1% | 11.3% | 19.3% |
Gender in Nashville
See the full breakdown
Nashville is 58.9% female with 3,377 female residents.
Nashville is 41.1% male with 2,352 male residents.
| Gender | Nashville | NC | USA |
|---|---|---|---|
| Female | 58.9% | 51.1% | 50.5% |
| Male | 41.1% | 48.9% | 49.5% |
Highest level of educational attainment in Nashville for adults over 25
See the full breakdown
1.0% of adults in Nashville completed < 9th grade.
12.0% of adults in Nashville completed 9-12th grade.
35.0% of adults in Nashville completed high school / ged.
19.0% of adults in Nashville completed some college.
17.0% of adults in Nashville completed associate's degree.
11.0% of adults in Nashville completed bachelor's degree.
5.0% of adults in Nashville completed master's degree.
0.0% of adults in Nashville completed professional degree.
0.0% of adults in Nashville completed doctorate degree.
| Education | Nashville | NC | USA |
|---|---|---|---|
| < 9th Grade | 1.0% | 3.0% | 4.0% |
| 9-12th Grade | 12.0% | 6.0% | 6.0% |
| High School / GED | 35.0% | 25.0% | 26.0% |
| Some College | 19.0% | 20.0% | 19.0% |
| Associate's Degree | 17.0% | 10.0% | 9.0% |
| Bachelor's Degree | 11.0% | 22.0% | 22.0% |
| Master's Degree | 5.0% | 10.0% | 10.0% |
| Professional Degree | 0.0% | 2.0% | 2.0% |
| Doctorate Degree | 0.0% | 2.0% | 2.0% |
Household Income For Nashville, North Carolina
See the full breakdown
1.9% of households in Nashville earn Less than $10,000.
9.0% of households in Nashville earn $10,000 to $14,999.
8.3% of households in Nashville earn $15,000 to $24,999.
4.9% of households in Nashville earn $25,000 to $34,999.
13.3% of households in Nashville earn $35,000 to $49,999.
23.4% of households in Nashville earn $50,000 to $74,999.
20.3% of households in Nashville earn $75,000 to $99,999.
10.8% of households in Nashville earn $100,000 to $149,999.
5.3% of households in Nashville earn $150,000 to $199,999.
2.9% of households in Nashville earn $200,000 or more.
| Income | Nashville | NC | USA |
|---|---|---|---|
| Less than $10,000 | 1.9% | 5.0% | 5.0% |
| $10,000 to $14,999 | 9.0% | 3.7% | 3.4% |
| $15,000 to $24,999 | 8.3% | 7.1% | 6.3% |
| $25,000 to $34,999 | 4.9% | 7.4% | 6.6% |
| $35,000 to $49,999 | 13.3% | 11.7% | 10.1% |
| $50,000 to $74,999 | 23.4% | 16.8% | 15.5% |
| $75,000 to $99,999 | 20.3% | 13.0% | 12.6% |
| $100,000 to $149,999 | 10.8% | 16.6% | 17.5% |
| $150,000 to $199,999 | 5.3% | 8.3% | 9.6% |
| $200,000 or more | 2.9% | 10.4% | 13.4% |
Source: U.S. Census ACS 5-year estimates (2024)


