Wilson SnackAbility
Overall SnackAbility
Crime in Wilson summary. We use data from the FBI to determine the crime rates in Wilson. Key points include:
There were 1,426 total crimes in Wilson in the last reporting year.
The overall crime rate per 100,000 people in Wilson is 2,981.7 / 100k people.
The violent crime rate per 100,000 people in Wilson is 579.2 / 100k people.
The property crime rate per 100,000 people in Wilson is 2,402.5 / 100k people.
Overall, crime in Wilson is 40.70% above the national average.
Total Crimes
Above National Average
Crime In Wilson Comparison Table
| Statistic | Count Raw |
Wilson / 100k People |
North Carolina / 100k People |
National / 100k People |
|---|---|---|---|---|
| Total Crimes Per 100K | 1,426 | 2,981.7 | 2,343.9 | 2,119.2 |
| Violent Crime | 277 | 579.2 | 375.8 | 359.0 |
| Murder | 12 | 25.1 | 7.5 | 5.0 |
| Robbery | 30 | 62.7 | 50.2 | 61.0 |
| Aggravated Assault | 222 | 464.2 | 290.1 | 256.0 |
| Property Crime | 1,149 | 2,402.5 | 1,968.1 | 1,760.0 |
| Burglary | 137 | 286.5 | 323.9 | 229.0 |
| Larceny | 900 | 1,881.9 | 1,390.2 | 1,272.0 |
| Car Theft | 112 | 234.2 | 254.1 | 259.0 |
Source: FBI Uniform Crime Reporting (2024)
Cost of living in Wilson summary. We use data on the cost of living to determine how expensive it is to live in Wilson. Real estate prices drive most of the variance in cost of living around North Carolina. Key points include:
The cost of living in Wilson is 95 with 100 being average.
The cost of living in Wilson is 0.9x lower than the national average.
The median home value in Wilson is $218,942.
The median income in Wilson is $52,485.
Wilson's Overall Cost Of Living
Lower Than The National Average
Cost Of Living In Wilson Comparison Table
| Living Expense | Wilson | North Carolina | National Average |
|---|---|---|---|
| Overall | 95 | 95 | 100 |
| Services | 100 | 98 | 100 |
| Groceries | 100 | 98 | 100 |
| Health | 79 | 89 | 100 |
| Housing | 98 | 100 | 100 |
| Transportation | 97 | 97 | 100 |
| Utilities | 101 | 101 | 100 |
Source: Cost of living index, normalized to US average = 100
Wilson, NC Weather
The average high in Wilson is 71.8° and the average low is 49.1°.
There are 77.9 days of precipitation each year.
Expect an average of 46.7 inches of precipitation each year with 1.8 inches of snow.
| Stat | Wilson |
|---|---|
| Average Annual High | 71.8 |
| Average Annual Low | 49.1 |
| Annual Precipitation Days | 77.9 |
| Average Annual Precipitation | 46.7 |
| Average Annual Snowfall | 1.8 |
Average High
Days of Rain
Source: NOAA climate normals (30-year)
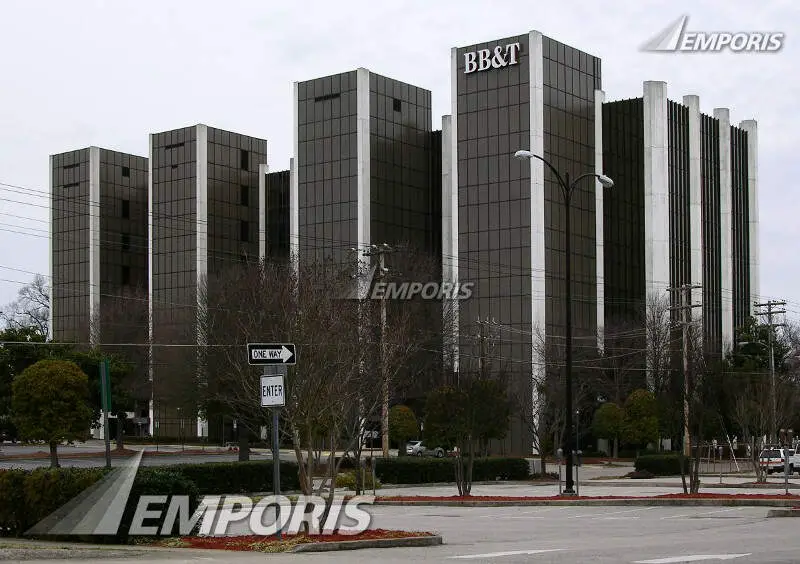
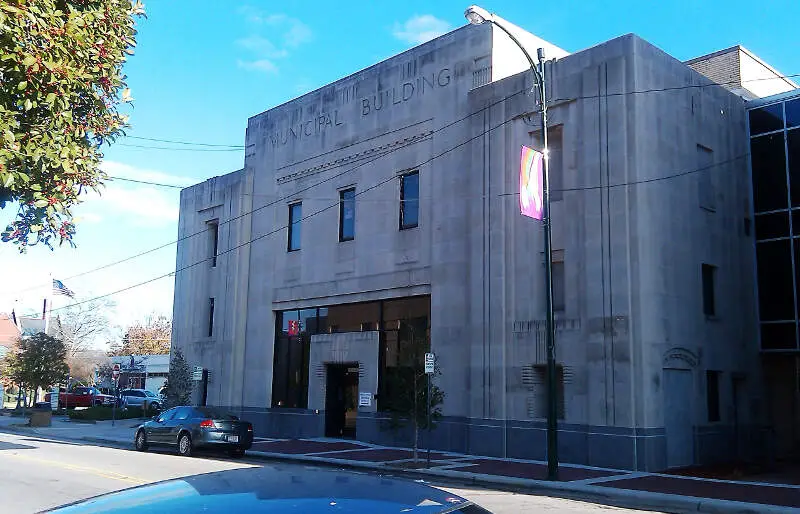
Wilson, NC Photos
1 Reviews & Comments About Wilson

I see more black kids skipping school than go...Unsafe to even walk your dog!! City of Wilson builds all these section 8 for tax income and brings the worse people to our once nice town. Come to Wilson bring a gun!!!
Blk drug houses in every neighborhood...all you have to do is watch!!! H****n...these lil skinnys selling lots of H****n all over Wilson NC.
Rankings & Articles For Wilson


Locations Around Wilson
Map Of Wilson, NC
Best Places Around Wilson
Jackson, MO
Population 15,659
Hendron, KY
Population 4,495
Cape Girardeau, MO
Population 40,344
Metropolis, IL
Population 5,864
Benton, KY
Population 4,748
Paducah, KY
Population 26,845
Wilson Demographics And Statistics
Population over time in Wilson
The current population in Wilson is 48,370. The population has increased 0.3% from 2010.
| Year | Population | % Change |
|---|---|---|
| 2024 | 48,370 | 1.3% |
| 2023 | 47,740 | -0.1% |
| 2022 | 47,767 | -0.3% |
| 2021 | 47,914 | -2.8% |
| 2020 | 49,310 | 0.1% |
| 2019 | 49,272 | 0.1% |
| 2018 | 49,230 | -0.0% |
| 2017 | 49,237 | -0.6% |
| 2016 | 49,558 | 0.2% |
| 2015 | 49,478 | 0.2% |
| 2014 | 49,389 | 0.1% |
| 2013 | 49,347 | 0.5% |
| 2012 | 49,086 | 0.8% |
| 2011 | 48,681 | 1.0% |
| 2010 | 48,219 | - |
Race / Ethnicity in Wilson
See the full breakdown
Wilson is:
34.9% White with 16,898 White residents.
46.9% African American with 22,693 African American residents.
0.2% American Indian with 109 American Indian residents.
1.7% Asian with 831 Asian residents.
0.0% Hawaiian with 0 Hawaiian residents.
0.7% Other with 334 Other residents.
3.0% Two Or More with 1,444 Two Or More residents.
12.5% Hispanic with 6,061 Hispanic residents.
| Race | Wilson | NC | USA |
|---|---|---|---|
| White | 34.9% | 60.0% | 57.4% |
| African American | 46.9% | 20.0% | 11.9% |
| American Indian | 0.2% | 0.8% | 0.5% |
| Asian | 1.7% | 3.3% | 5.9% |
| Hawaiian | 0.0% | 0.1% | 0.2% |
| Other | 0.7% | 0.5% | 0.6% |
| Two Or More | 3.0% | 4.1% | 4.3% |
| Hispanic | 12.5% | 11.3% | 19.3% |
Gender in Wilson
See the full breakdown
Wilson is 53.4% female with 25,818 female residents.
Wilson is 46.6% male with 22,552 male residents.
| Gender | Wilson | NC | USA |
|---|---|---|---|
| Female | 53.4% | 51.1% | 50.5% |
| Male | 46.6% | 48.9% | 49.5% |
Highest level of educational attainment in Wilson for adults over 25
See the full breakdown
6.0% of adults in Wilson completed < 9th grade.
9.0% of adults in Wilson completed 9-12th grade.
32.0% of adults in Wilson completed high school / ged.
18.0% of adults in Wilson completed some college.
10.0% of adults in Wilson completed associate's degree.
15.0% of adults in Wilson completed bachelor's degree.
7.0% of adults in Wilson completed master's degree.
2.0% of adults in Wilson completed professional degree.
1.0% of adults in Wilson completed doctorate degree.
| Education | Wilson | NC | USA |
|---|---|---|---|
| < 9th Grade | 6.0% | 3.0% | 4.0% |
| 9-12th Grade | 9.0% | 6.0% | 6.0% |
| High School / GED | 32.0% | 25.0% | 26.0% |
| Some College | 18.0% | 20.0% | 19.0% |
| Associate's Degree | 10.0% | 10.0% | 9.0% |
| Bachelor's Degree | 15.0% | 22.0% | 22.0% |
| Master's Degree | 7.0% | 10.0% | 10.0% |
| Professional Degree | 2.0% | 2.0% | 2.0% |
| Doctorate Degree | 1.0% | 2.0% | 2.0% |
Household Income For Wilson, North Carolina
See the full breakdown
8.6% of households in Wilson earn Less than $10,000.
5.7% of households in Wilson earn $10,000 to $14,999.
9.9% of households in Wilson earn $15,000 to $24,999.
8.9% of households in Wilson earn $25,000 to $34,999.
14.1% of households in Wilson earn $35,000 to $49,999.
17.3% of households in Wilson earn $50,000 to $74,999.
13.2% of households in Wilson earn $75,000 to $99,999.
13.2% of households in Wilson earn $100,000 to $149,999.
3.6% of households in Wilson earn $150,000 to $199,999.
5.4% of households in Wilson earn $200,000 or more.
| Income | Wilson | NC | USA |
|---|---|---|---|
| Less than $10,000 | 8.6% | 5.0% | 5.0% |
| $10,000 to $14,999 | 5.7% | 3.7% | 3.4% |
| $15,000 to $24,999 | 9.9% | 7.1% | 6.3% |
| $25,000 to $34,999 | 8.9% | 7.4% | 6.6% |
| $35,000 to $49,999 | 14.1% | 11.7% | 10.1% |
| $50,000 to $74,999 | 17.3% | 16.8% | 15.5% |
| $75,000 to $99,999 | 13.2% | 13.0% | 12.6% |
| $100,000 to $149,999 | 13.2% | 16.6% | 17.5% |
| $150,000 to $199,999 | 3.6% | 8.3% | 9.6% |
| $200,000 or more | 5.4% | 10.4% | 13.4% |
Source: U.S. Census ACS 5-year estimates (2024)


