Winston-Salem SnackAbility
Overall SnackAbility
Crime in Winston-Salem summary. We use data from the FBI to determine the crime rates in Winston-Salem. Key points include:
There were 9,478 total crimes in Winston-Salem in the last reporting year.
The overall crime rate per 100,000 people in Winston-Salem is 3,730.9 / 100k people.
The violent crime rate per 100,000 people in Winston-Salem is 809.7 / 100k people.
The property crime rate per 100,000 people in Winston-Salem is 2,921.2 / 100k people.
Overall, crime in Winston-Salem is 76.05% above the national average.
Total Crimes
Above National Average
Crime In Winston-Salem Comparison Table
| Statistic | Count Raw |
Winston-Salem / 100k People |
North Carolina / 100k People |
National / 100k People |
|---|---|---|---|---|
| Total Crimes Per 100K | 9,478 | 3,730.9 | 2,343.9 | 2,119.2 |
| Violent Crime | 2,057 | 809.7 | 375.8 | 359.0 |
| Murder | 29 | 11.4 | 7.5 | 5.0 |
| Robbery | 247 | 97.2 | 50.2 | 61.0 |
| Aggravated Assault | 1,664 | 655.0 | 290.1 | 256.0 |
| Property Crime | 7,421 | 2,921.2 | 1,968.1 | 1,760.0 |
| Burglary | 1,448 | 570.0 | 323.9 | 229.0 |
| Larceny | 5,073 | 1,996.9 | 1,390.2 | 1,272.0 |
| Car Theft | 900 | 354.3 | 254.1 | 259.0 |
Source: FBI Uniform Crime Reporting (2024)
Cost of living in Winston-Salem summary. We use data on the cost of living to determine how expensive it is to live in Winston-Salem. Real estate prices drive most of the variance in cost of living around North Carolina. Key points include:
The cost of living in Winston-Salem is 93 with 100 being average.
The cost of living in Winston-Salem is 0.9x lower than the national average.
The median home value in Winston-Salem is $264,332.
The median income in Winston-Salem is $59,268.
Winston-Salem's Overall Cost Of Living
Lower Than The National Average
Cost Of Living In Winston-Salem Comparison Table
| Living Expense | Winston-Salem | North Carolina | National Average |
|---|---|---|---|
| Overall | 93 | 95 | 100 |
| Services | 99 | 98 | 100 |
| Groceries | 100 | 98 | 100 |
| Health | 83 | 89 | 100 |
| Housing | 100 | 100 | 100 |
| Transportation | 97 | 97 | 100 |
| Utilities | 96 | 101 | 100 |
Source: Cost of living index, normalized to US average = 100
Winston-Salem, NC Weather
The average high in Winston-Salem is 69.7° and the average low is 47.2°.
There are 74.3 days of precipitation each year.
Expect an average of 44.1 inches of precipitation each year with 6.2 inches of snow.
| Stat | Winston-Salem |
|---|---|
| Average Annual High | 69.7 |
| Average Annual Low | 47.2 |
| Annual Precipitation Days | 74.3 |
| Average Annual Precipitation | 44.1 |
| Average Annual Snowfall | 6.2 |
Average High
Days of Rain
Source: NOAA climate normals (30-year)
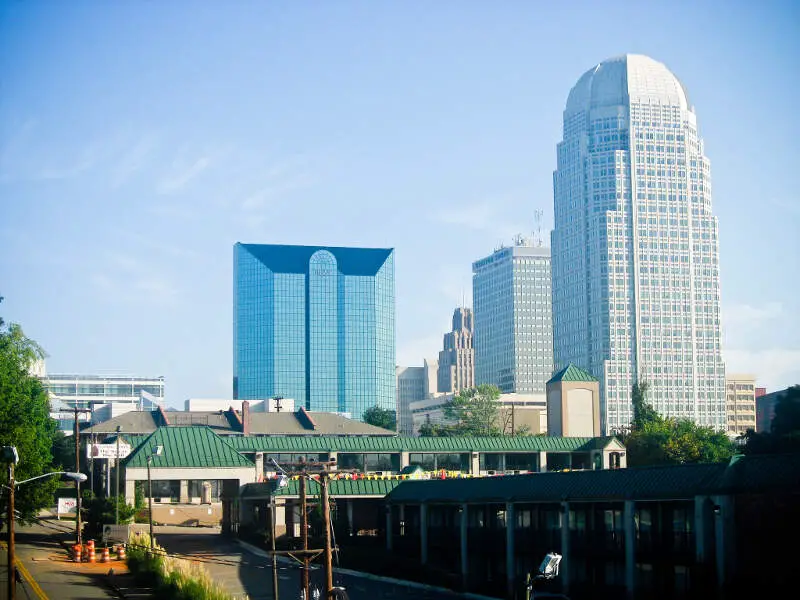
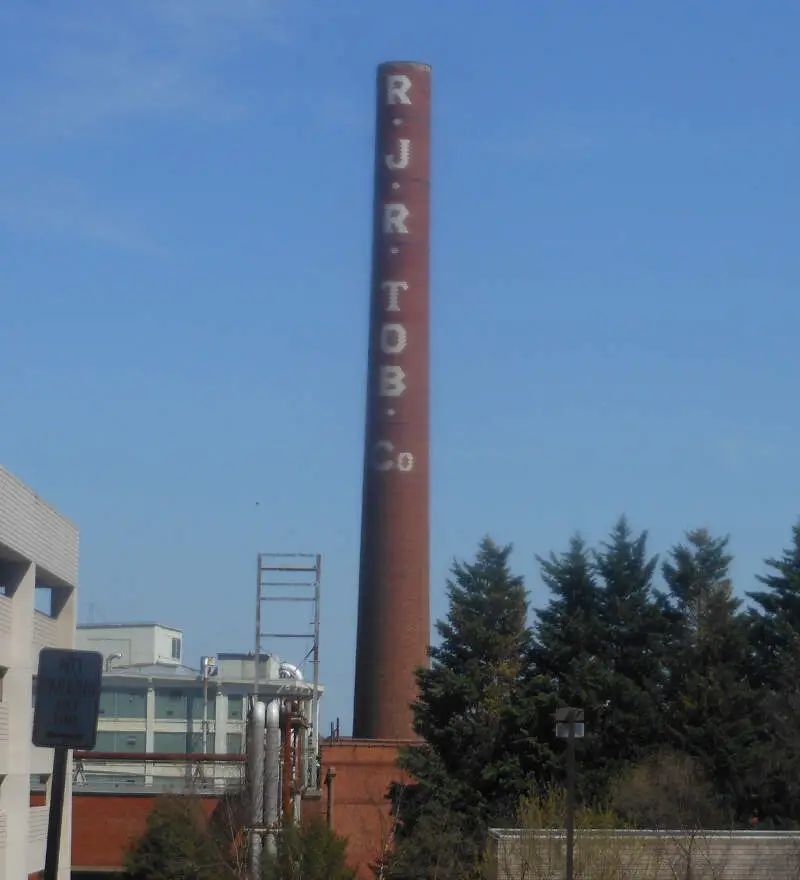
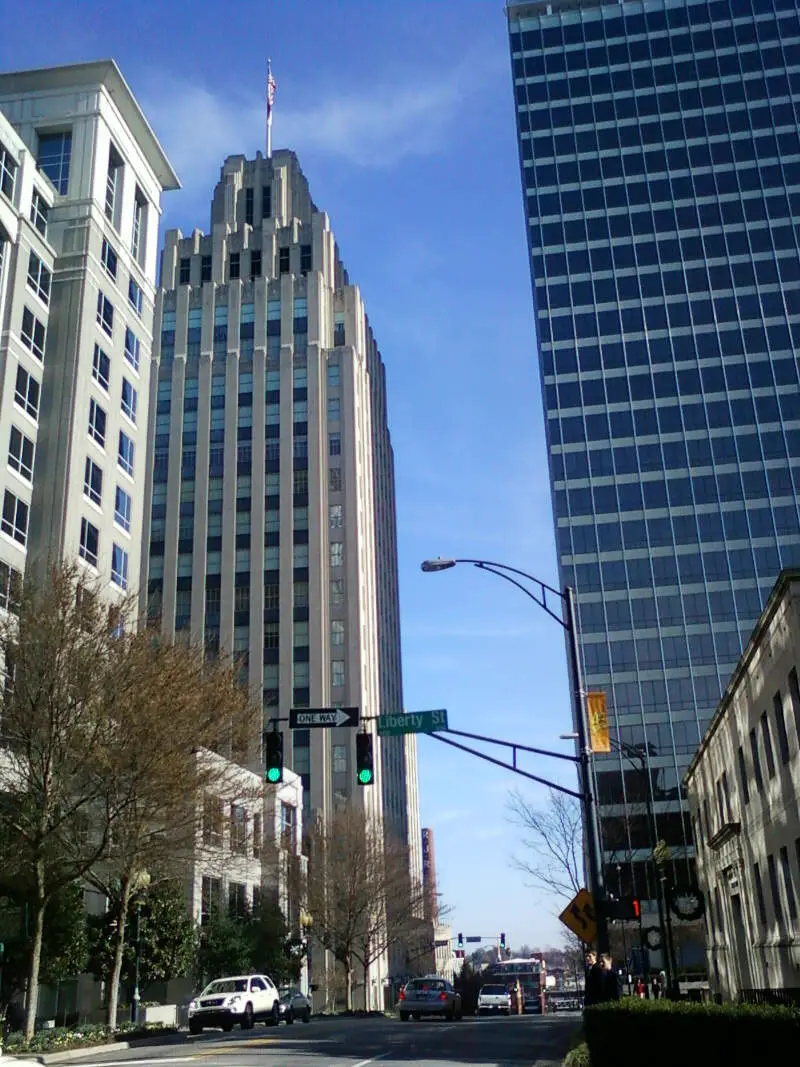
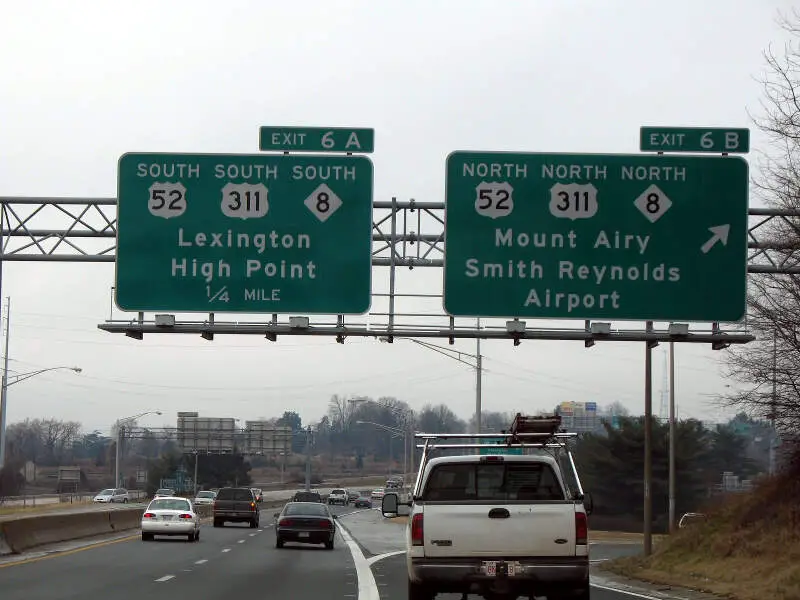
Winston-Salem, NC Photos

Rankings & Articles For Winston-Salem


Locations Around Winston-Salem
Map Of Winston-Salem, NC
Best Places Around Winston-Salem
Clemmons, NC
Population 21,871
King, NC
Population 7,408
Oak Ridge, NC
Population 7,744
Lewisville, NC
Population 13,828
Kernersville, NC
Population 27,830
Stokesdale, NC
Population 6,004
High Point, NC
Population 116,245
Thomasville, NC
Population 27,321
Jamestown, ND
Population 15,787
Winston-Salem Demographics And Statistics
Population over time in Winston-Salem
The current population in Winston-Salem is 252,037. The population has increased 12.1% from 2010.
| Year | Population | % Change |
|---|---|---|
| 2024 | 252,037 | 0.5% |
| 2023 | 250,887 | 0.5% |
| 2022 | 249,571 | 0.7% |
| 2021 | 247,917 | 0.9% |
| 2020 | 245,787 | 0.7% |
| 2019 | 244,115 | 0.8% |
| 2018 | 242,125 | - |
| 2017 | 0 | -100.0% |
| 2016 | 238,474 | 0.8% |
| 2015 | 236,642 | 0.9% |
| 2014 | 234,469 | 1.0% |
| 2013 | 232,219 | 1.0% |
| 2012 | 230,030 | 1.0% |
| 2011 | 227,691 | 1.3% |
| 2010 | 224,769 | - |
Race / Ethnicity in Winston-Salem
See the full breakdown
Winston-Salem is:
43.6% White with 109,867 White residents.
31.2% African American with 78,616 African American residents.
0.1% American Indian with 340 American Indian residents.
2.3% Asian with 5,756 Asian residents.
0.1% Hawaiian with 199 Hawaiian residents.
0.5% Other with 1,367 Other residents.
4.0% Two Or More with 10,103 Two Or More residents.
18.2% Hispanic with 45,789 Hispanic residents.
| Race | Winston-Salem | NC | USA |
|---|---|---|---|
| White | 43.6% | 60.0% | 57.4% |
| African American | 31.2% | 20.0% | 11.9% |
| American Indian | 0.1% | 0.8% | 0.5% |
| Asian | 2.3% | 3.3% | 5.9% |
| Hawaiian | 0.1% | 0.1% | 0.2% |
| Other | 0.5% | 0.5% | 0.6% |
| Two Or More | 4.0% | 4.1% | 4.3% |
| Hispanic | 18.2% | 11.3% | 19.3% |
Gender in Winston-Salem
See the full breakdown
Winston-Salem is 53.4% female with 134,559 female residents.
Winston-Salem is 46.6% male with 117,477 male residents.
| Gender | Winston-Salem | NC | USA |
|---|---|---|---|
| Female | 53.4% | 51.1% | 50.5% |
| Male | 46.6% | 48.9% | 49.5% |
Highest level of educational attainment in Winston-Salem for adults over 25
See the full breakdown
4.0% of adults in Winston-Salem completed < 9th grade.
6.0% of adults in Winston-Salem completed 9-12th grade.
23.0% of adults in Winston-Salem completed high school / ged.
19.0% of adults in Winston-Salem completed some college.
8.0% of adults in Winston-Salem completed associate's degree.
23.0% of adults in Winston-Salem completed bachelor's degree.
11.0% of adults in Winston-Salem completed master's degree.
3.0% of adults in Winston-Salem completed professional degree.
3.0% of adults in Winston-Salem completed doctorate degree.
| Education | Winston-Salem | NC | USA |
|---|---|---|---|
| < 9th Grade | 4.0% | 3.0% | 4.0% |
| 9-12th Grade | 6.0% | 6.0% | 6.0% |
| High School / GED | 23.0% | 25.0% | 26.0% |
| Some College | 19.0% | 20.0% | 19.0% |
| Associate's Degree | 8.0% | 10.0% | 9.0% |
| Bachelor's Degree | 23.0% | 22.0% | 22.0% |
| Master's Degree | 11.0% | 10.0% | 10.0% |
| Professional Degree | 3.0% | 2.0% | 2.0% |
| Doctorate Degree | 3.0% | 2.0% | 2.0% |
Household Income For Winston-Salem, North Carolina
See the full breakdown
6.6% of households in Winston-Salem earn Less than $10,000.
5.6% of households in Winston-Salem earn $10,000 to $14,999.
7.8% of households in Winston-Salem earn $15,000 to $24,999.
9.1% of households in Winston-Salem earn $25,000 to $34,999.
13.7% of households in Winston-Salem earn $35,000 to $49,999.
17.1% of households in Winston-Salem earn $50,000 to $74,999.
12.2% of households in Winston-Salem earn $75,000 to $99,999.
13.6% of households in Winston-Salem earn $100,000 to $149,999.
6.4% of households in Winston-Salem earn $150,000 to $199,999.
8.0% of households in Winston-Salem earn $200,000 or more.
| Income | Winston-Salem | NC | USA |
|---|---|---|---|
| Less than $10,000 | 6.6% | 5.0% | 5.0% |
| $10,000 to $14,999 | 5.6% | 3.7% | 3.4% |
| $15,000 to $24,999 | 7.8% | 7.1% | 6.3% |
| $25,000 to $34,999 | 9.1% | 7.4% | 6.6% |
| $35,000 to $49,999 | 13.7% | 11.7% | 10.1% |
| $50,000 to $74,999 | 17.1% | 16.8% | 15.5% |
| $75,000 to $99,999 | 12.2% | 13.0% | 12.6% |
| $100,000 to $149,999 | 13.6% | 16.6% | 17.5% |
| $150,000 to $199,999 | 6.4% | 8.3% | 9.6% |
| $200,000 or more | 8.0% | 10.4% | 13.4% |
Source: U.S. Census ACS 5-year estimates (2024)


