Bismarck SnackAbility
Overall SnackAbility
Crime in Bismarck summary. We use data from the FBI to determine the crime rates in Bismarck. Key points include:
There were 2,023 total crimes in Bismarck in the last reporting year.
The overall crime rate per 100,000 people in Bismarck is 2,677.8 / 100k people.
The violent crime rate per 100,000 people in Bismarck is 278.0 / 100k people.
The property crime rate per 100,000 people in Bismarck is 2,399.9 / 100k people.
Overall, crime in Bismarck is 26.36% above the national average.
Total Crimes
Above National Average
Crime In Bismarck Comparison Table
| Statistic | Count Raw |
Bismarck / 100k People |
North Dakota / 100k People |
National / 100k People |
|---|---|---|---|---|
| Total Crimes Per 100K | 2,023 | 2,677.8 | 1,936.4 | 2,119.2 |
| Violent Crime | 210 | 278.0 | 254.3 | 359.0 |
| Murder | 1 | 1.3 | 2.6 | 5.0 |
| Robbery | 46 | 60.9 | 27.4 | 61.0 |
| Aggravated Assault | 129 | 170.8 | 174.5 | 256.0 |
| Property Crime | 1,813 | 2,399.9 | 1,682.1 | 1,760.0 |
| Burglary | 187 | 247.5 | 271.2 | 229.0 |
| Larceny | 1,452 | 1,922.0 | 1,229.9 | 1,272.0 |
| Car Theft | 174 | 230.3 | 181.0 | 259.0 |
Source: FBI Uniform Crime Reporting (2024)
Cost of living in Bismarck summary. We use data on the cost of living to determine how expensive it is to live in Bismarck. Real estate prices drive most of the variance in cost of living around North Dakota. Key points include:
The cost of living in Bismarck is 108 with 100 being average.
The cost of living in Bismarck is 1.1x higher than the national average.
The median home value in Bismarck is $369,558.
The median income in Bismarck is $78,387.
Bismarck's Overall Cost Of Living
Higher Than The National Average
Cost Of Living In Bismarck Comparison Table
| Living Expense | Bismarck | North Dakota | National Average |
|---|---|---|---|
| Overall | 108 | 94 | 100 |
| Services | 98 | 99 | 100 |
| Groceries | 100 | 98 | 100 |
| Health | 124 | 87 | 100 |
| Housing | 96 | 99 | 100 |
| Transportation | 102 | 102 | 100 |
| Utilities | 95 | 99 | 100 |
Source: Cost of living index, normalized to US average = 100
Bismarck, ND Weather
The average high in Bismarck is 54.8° and the average low is 30.9°.
There are 39.7 days of precipitation each year.
Expect an average of 17.9 inches of precipitation each year with 50.1 inches of snow.
| Stat | Bismarck |
|---|---|
| Average Annual High | 54.8 |
| Average Annual Low | 30.9 |
| Annual Precipitation Days | 39.7 |
| Average Annual Precipitation | 17.9 |
| Average Annual Snowfall | 50.1 |
Average High
Days of Rain
Source: NOAA climate normals (30-year)
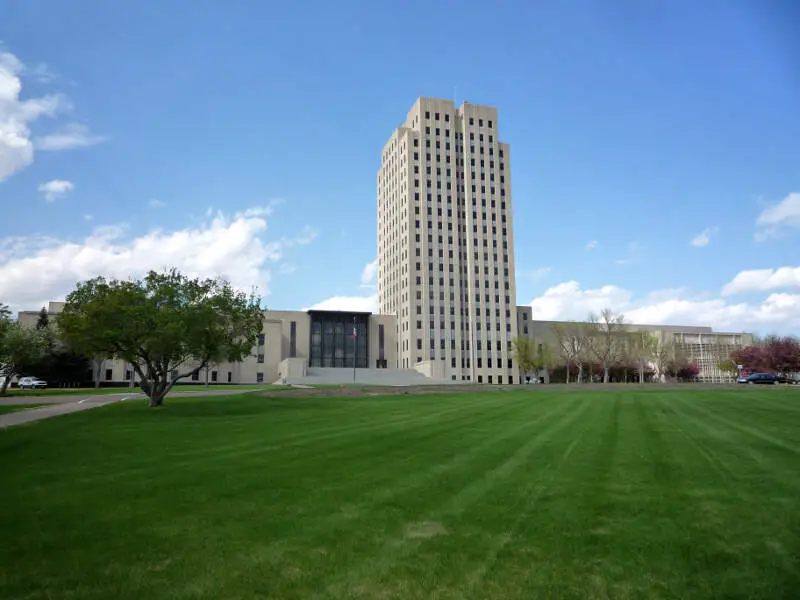
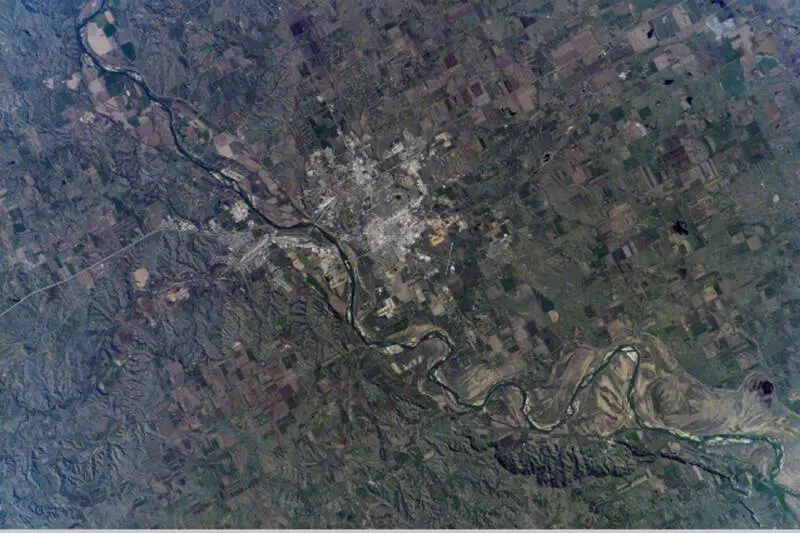
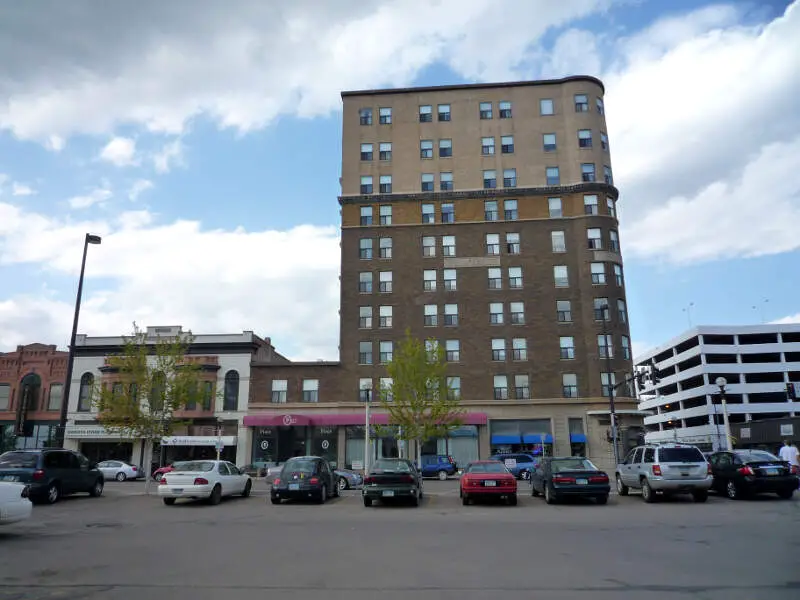
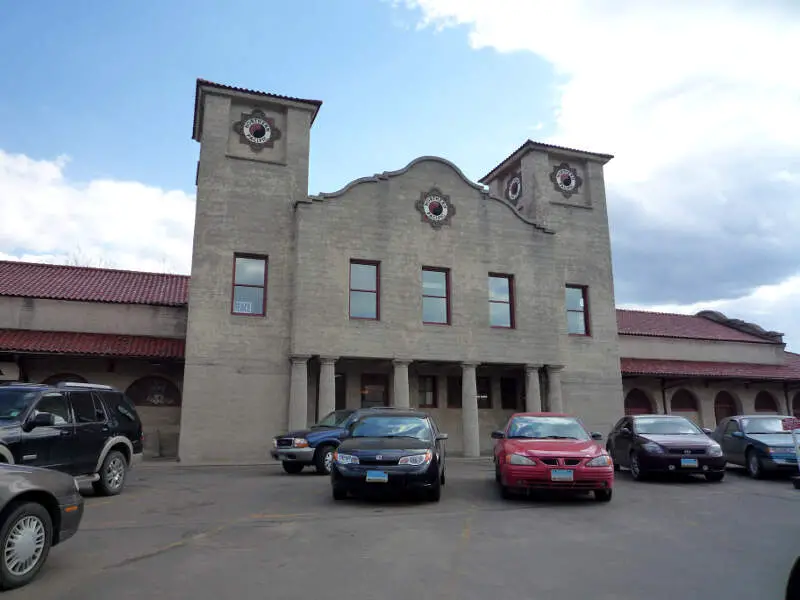
Bismarck, ND Photos

1 Reviews & Comments About Bismarck

Currently live in Bismarck. I could only live here or Fargo/West Fargo in this state. I love ND though, and it truly is the best state in the country
Rankings & Articles For Bismarck


Locations Around Bismarck
Map Of Bismarck, ND
Bismarck Demographics And Statistics
Population over time in Bismarck
The current population in Bismarck is 75,556. The population has increased 26.0% from 2010.
| Year | Population | % Change |
|---|---|---|
| 2024 | 75,556 | 1.9% |
| 2023 | 74,146 | 0.6% |
| 2022 | 73,694 | 0.5% |
| 2021 | 73,321 | -0.2% |
| 2020 | 73,435 | 0.9% |
| 2019 | 72,777 | 1.5% |
| 2018 | 71,731 | 1.7% |
| 2017 | 70,536 | 2.3% |
| 2016 | 68,981 | 3.0% |
| 2015 | 66,980 | 2.9% |
| 2014 | 65,123 | 2.8% |
| 2013 | 63,353 | 2.3% |
| 2012 | 61,941 | 1.8% |
| 2011 | 60,831 | 1.4% |
| 2010 | 59,988 | - |
Race / Ethnicity in Bismarck
See the full breakdown
Bismarck is:
82.8% White with 62,555 White residents.
2.5% African American with 1,893 African American residents.
4.0% American Indian with 3,036 American Indian residents.
1.2% Asian with 931 Asian residents.
0.7% Hawaiian with 508 Hawaiian residents.
0.2% Other with 141 Other residents.
5.1% Two Or More with 3,872 Two Or More residents.
3.5% Hispanic with 2,620 Hispanic residents.
| Race | Bismarck | ND | USA |
|---|---|---|---|
| White | 82.8% | 81.7% | 57.4% |
| African American | 2.5% | 3.3% | 11.9% |
| American Indian | 4.0% | 4.2% | 0.5% |
| Asian | 1.2% | 1.6% | 5.9% |
| Hawaiian | 0.7% | 0.1% | 0.2% |
| Other | 0.2% | 0.3% | 0.6% |
| Two Or More | 5.1% | 4.0% | 4.3% |
| Hispanic | 3.5% | 4.7% | 19.3% |
Gender in Bismarck
See the full breakdown
Bismarck is 50.2% female with 37,924 female residents.
Bismarck is 49.8% male with 37,632 male residents.
| Gender | Bismarck | ND | USA |
|---|---|---|---|
| Female | 50.2% | 48.8% | 50.5% |
| Male | 49.8% | 51.2% | 49.5% |
Highest level of educational attainment in Bismarck for adults over 25
See the full breakdown
3.0% of adults in Bismarck completed < 9th grade.
3.0% of adults in Bismarck completed 9-12th grade.
22.0% of adults in Bismarck completed high school / ged.
19.0% of adults in Bismarck completed some college.
14.0% of adults in Bismarck completed associate's degree.
27.0% of adults in Bismarck completed bachelor's degree.
9.0% of adults in Bismarck completed master's degree.
2.0% of adults in Bismarck completed professional degree.
1.0% of adults in Bismarck completed doctorate degree.
| Education | Bismarck | ND | USA |
|---|---|---|---|
| < 9th Grade | 3.0% | 1.0% | 4.0% |
| 9-12th Grade | 3.0% | 4.0% | 6.0% |
| High School / GED | 22.0% | 26.0% | 26.0% |
| Some College | 19.0% | 22.0% | 19.0% |
| Associate's Degree | 14.0% | 14.0% | 9.0% |
| Bachelor's Degree | 27.0% | 23.0% | 22.0% |
| Master's Degree | 9.0% | 7.0% | 10.0% |
| Professional Degree | 2.0% | 2.0% | 2.0% |
| Doctorate Degree | 1.0% | 1.0% | 2.0% |
Household Income For Bismarck, North Dakota
See the full breakdown
4.4% of households in Bismarck earn Less than $10,000.
2.5% of households in Bismarck earn $10,000 to $14,999.
6.7% of households in Bismarck earn $15,000 to $24,999.
6.5% of households in Bismarck earn $25,000 to $34,999.
9.6% of households in Bismarck earn $35,000 to $49,999.
18.4% of households in Bismarck earn $50,000 to $74,999.
13.4% of households in Bismarck earn $75,000 to $99,999.
18.8% of households in Bismarck earn $100,000 to $149,999.
9.7% of households in Bismarck earn $150,000 to $199,999.
9.9% of households in Bismarck earn $200,000 or more.
| Income | Bismarck | ND | USA |
|---|---|---|---|
| Less than $10,000 | 4.4% | 4.6% | 5.0% |
| $10,000 to $14,999 | 2.5% | 3.2% | 3.4% |
| $15,000 to $24,999 | 6.7% | 6.5% | 6.3% |
| $25,000 to $34,999 | 6.5% | 7.1% | 6.6% |
| $35,000 to $49,999 | 9.6% | 10.8% | 10.1% |
| $50,000 to $74,999 | 18.4% | 16.6% | 15.5% |
| $75,000 to $99,999 | 13.4% | 13.9% | 12.6% |
| $100,000 to $149,999 | 18.8% | 18.6% | 17.5% |
| $150,000 to $199,999 | 9.7% | 9.0% | 9.6% |
| $200,000 or more | 9.9% | 9.6% | 13.4% |
Source: U.S. Census ACS 5-year estimates (2024)


