Fargo SnackAbility
Overall SnackAbility
Crime in Fargo summary. We use data from the FBI to determine the crime rates in Fargo. Key points include:
There were 5,692 total crimes in Fargo in the last reporting year.
The overall crime rate per 100,000 people in Fargo is 4,195.1 / 100k people.
The violent crime rate per 100,000 people in Fargo is 498.2 / 100k people.
The property crime rate per 100,000 people in Fargo is 3,696.9 / 100k people.
Overall, crime in Fargo is 97.95% above the national average.
Total Crimes
Above National Average
Crime In Fargo Comparison Table
| Statistic | Count Raw |
Fargo / 100k People |
North Dakota / 100k People |
National / 100k People |
|---|---|---|---|---|
| Total Crimes Per 100K | 5,692 | 4,195.1 | 1,936.4 | 2,119.2 |
| Violent Crime | 676 | 498.2 | 254.3 | 359.0 |
| Murder | 6 | 4.4 | 2.6 | 5.0 |
| Robbery | 105 | 77.4 | 27.4 | 61.0 |
| Aggravated Assault | 426 | 314.0 | 174.5 | 256.0 |
| Property Crime | 5,016 | 3,696.9 | 1,682.1 | 1,760.0 |
| Burglary | 1,006 | 741.4 | 271.2 | 229.0 |
| Larceny | 3,529 | 2,600.9 | 1,229.9 | 1,272.0 |
| Car Theft | 481 | 354.5 | 181.0 | 259.0 |
Source: FBI Uniform Crime Reporting (2024)
Cost of living in Fargo summary. We use data on the cost of living to determine how expensive it is to live in Fargo. Real estate prices drive most of the variance in cost of living around North Dakota. Key points include:
The cost of living in Fargo is 102 with 100 being average.
The cost of living in Fargo is 1.0x higher than the national average.
The median home value in Fargo is $314,972.
The median income in Fargo is $66,998.
Fargo's Overall Cost Of Living
Higher Than The National Average
Cost Of Living In Fargo Comparison Table
| Living Expense | Fargo | North Dakota | National Average |
|---|---|---|---|
| Overall | 102 | 94 | 100 |
| Services | 98 | 99 | 100 |
| Groceries | 102 | 98 | 100 |
| Health | 111 | 87 | 100 |
| Housing | 101 | 99 | 100 |
| Transportation | 108 | 102 | 100 |
| Utilities | 97 | 99 | 100 |
Source: Cost of living index, normalized to US average = 100
Fargo, ND Weather
The average high in Fargo is 52.6° and the average low is 31.9°.
There are 48.6 days of precipitation each year.
Expect an average of 23.8 inches of precipitation each year with 52.1 inches of snow.
| Stat | Fargo |
|---|---|
| Average Annual High | 52.6 |
| Average Annual Low | 31.9 |
| Annual Precipitation Days | 48.6 |
| Average Annual Precipitation | 23.8 |
| Average Annual Snowfall | 52.1 |
Average High
Days of Rain
Source: NOAA climate normals (30-year)
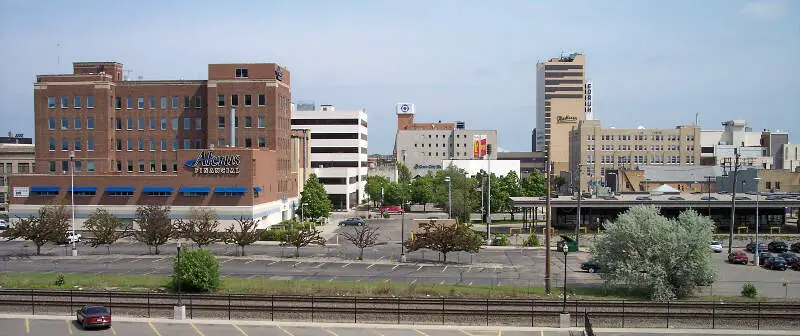
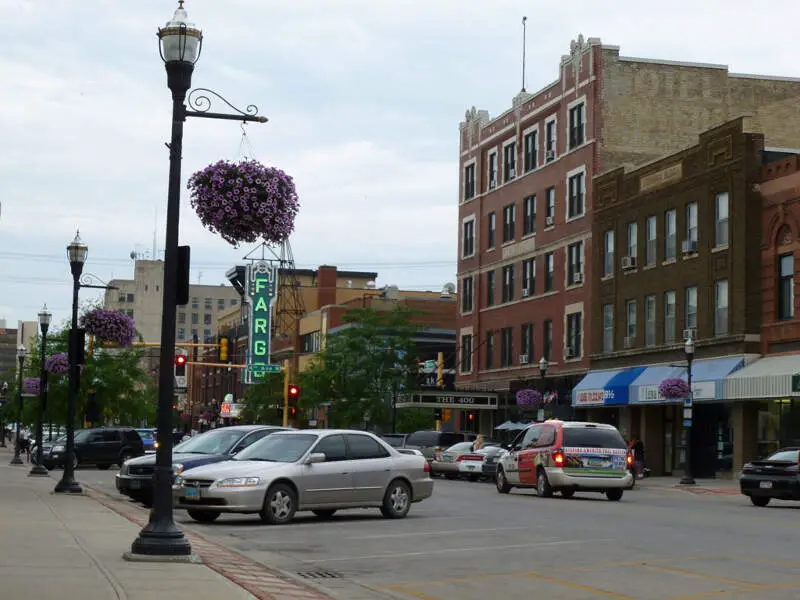
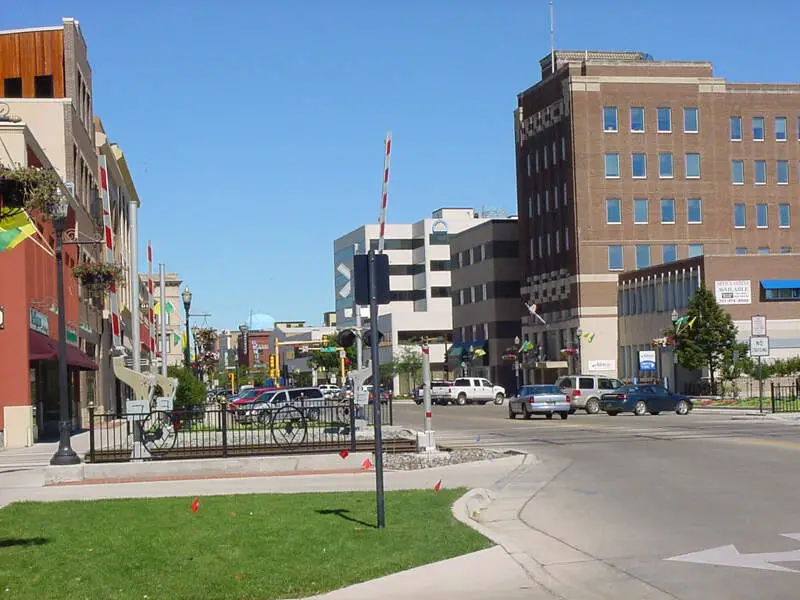
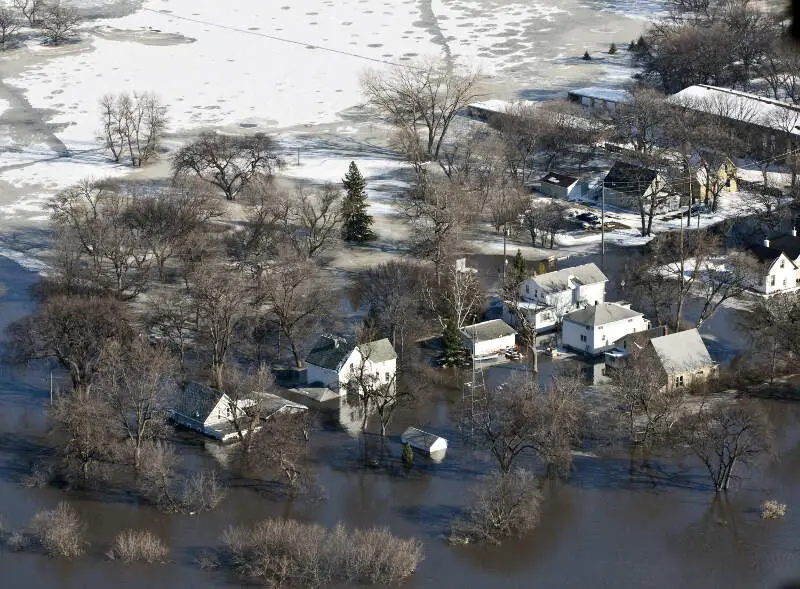
Fargo, ND Photos


1 Reviews & Comments About Fargo

i live in fargo, ND and i can tell you we have a s******d of drunks.
Rankings & Articles For Fargo


Locations Around Fargo
Map Of Fargo, ND
Best Places Around Fargo
Moorhead, MN
Population 45,036
Horace, ND
Population 4,588
Casselton, ND
Population 2,953
West Fargo, ND
Population 40,094
Wahpeton, ND
Population 8,010
Detroit Lakes, MN
Population 10,025
Fargo Demographics And Statistics
Population over time in Fargo
The current population in Fargo is 131,627. The population has increased 28.4% from 2010.
| Year | Population | % Change |
|---|---|---|
| 2024 | 131,627 | 2.0% |
| 2023 | 129,064 | 1.4% |
| 2022 | 127,319 | 1.9% |
| 2021 | 124,979 | 1.2% |
| 2020 | 123,550 | 1.4% |
| 2019 | 121,889 | 1.4% |
| 2018 | 120,209 | 1.8% |
| 2017 | 118,099 | 1.9% |
| 2016 | 115,950 | 2.2% |
| 2015 | 113,464 | 2.5% |
| 2014 | 110,725 | 2.2% |
| 2013 | 108,371 | 2.2% |
| 2012 | 106,005 | 1.7% |
| 2011 | 104,193 | 1.6% |
| 2010 | 102,527 | - |
Race / Ethnicity in Fargo
See the full breakdown
Fargo is:
78.6% White with 103,488 White residents.
8.6% African American with 11,305 African American residents.
0.9% American Indian with 1,155 American Indian residents.
4.0% Asian with 5,326 Asian residents.
0.0% Hawaiian with 4 Hawaiian residents.
0.6% Other with 794 Other residents.
3.6% Two Or More with 4,763 Two Or More residents.
3.6% Hispanic with 4,792 Hispanic residents.
| Race | Fargo | ND | USA |
|---|---|---|---|
| White | 78.6% | 81.7% | 57.4% |
| African American | 8.6% | 3.3% | 11.9% |
| American Indian | 0.9% | 4.2% | 0.5% |
| Asian | 4.0% | 1.6% | 5.9% |
| Hawaiian | 0.0% | 0.1% | 0.2% |
| Other | 0.6% | 0.3% | 0.6% |
| Two Or More | 3.6% | 4.0% | 4.3% |
| Hispanic | 3.6% | 4.7% | 19.3% |
Gender in Fargo
See the full breakdown
Fargo is 49.7% female with 65,368 female residents.
Fargo is 50.3% male with 66,258 male residents.
| Gender | Fargo | ND | USA |
|---|---|---|---|
| Female | 49.7% | 48.8% | 50.5% |
| Male | 50.3% | 51.2% | 49.5% |
Highest level of educational attainment in Fargo for adults over 25
See the full breakdown
2.0% of adults in Fargo completed < 9th grade.
3.0% of adults in Fargo completed 9-12th grade.
18.0% of adults in Fargo completed high school / ged.
21.0% of adults in Fargo completed some college.
13.0% of adults in Fargo completed associate's degree.
29.0% of adults in Fargo completed bachelor's degree.
10.0% of adults in Fargo completed master's degree.
2.0% of adults in Fargo completed professional degree.
2.0% of adults in Fargo completed doctorate degree.
| Education | Fargo | ND | USA |
|---|---|---|---|
| < 9th Grade | 2.0% | 1.0% | 4.0% |
| 9-12th Grade | 3.0% | 4.0% | 6.0% |
| High School / GED | 18.0% | 26.0% | 26.0% |
| Some College | 21.0% | 22.0% | 19.0% |
| Associate's Degree | 13.0% | 14.0% | 9.0% |
| Bachelor's Degree | 29.0% | 23.0% | 22.0% |
| Master's Degree | 10.0% | 7.0% | 10.0% |
| Professional Degree | 2.0% | 2.0% | 2.0% |
| Doctorate Degree | 2.0% | 1.0% | 2.0% |
Household Income For Fargo, North Dakota
See the full breakdown
4.8% of households in Fargo earn Less than $10,000.
3.7% of households in Fargo earn $10,000 to $14,999.
7.0% of households in Fargo earn $15,000 to $24,999.
9.1% of households in Fargo earn $25,000 to $34,999.
12.9% of households in Fargo earn $35,000 to $49,999.
17.5% of households in Fargo earn $50,000 to $74,999.
13.6% of households in Fargo earn $75,000 to $99,999.
16.3% of households in Fargo earn $100,000 to $149,999.
6.8% of households in Fargo earn $150,000 to $199,999.
8.3% of households in Fargo earn $200,000 or more.
| Income | Fargo | ND | USA |
|---|---|---|---|
| Less than $10,000 | 4.8% | 4.6% | 5.0% |
| $10,000 to $14,999 | 3.7% | 3.2% | 3.4% |
| $15,000 to $24,999 | 7.0% | 6.5% | 6.3% |
| $25,000 to $34,999 | 9.1% | 7.1% | 6.6% |
| $35,000 to $49,999 | 12.9% | 10.8% | 10.1% |
| $50,000 to $74,999 | 17.5% | 16.6% | 15.5% |
| $75,000 to $99,999 | 13.6% | 13.9% | 12.6% |
| $100,000 to $149,999 | 16.3% | 18.6% | 17.5% |
| $150,000 to $199,999 | 6.8% | 9.0% | 9.6% |
| $200,000 or more | 8.3% | 9.6% | 13.4% |
Source: U.S. Census ACS 5-year estimates (2024)


