Concord SnackAbility
Overall SnackAbility
Crime in Concord summary. We use data from the FBI to determine the crime rates in Concord. Key points include:
There were 632 total crimes in Concord in the last reporting year.
The overall crime rate per 100,000 people in Concord is 1,409.9 / 100k people.
The violent crime rate per 100,000 people in Concord is 180.7 / 100k people.
The property crime rate per 100,000 people in Concord is 1,229.2 / 100k people.
Overall, crime in Concord is -33.47% below the national average.
Total Crimes
Below National Average
Crime In Concord Comparison Table
| Statistic | Count Raw | Concord / 100k People | New Hampshire / 100k People | National / 100k People |
|---|---|---|---|---|
| Total Crimes Per 100K | 632 | 1,409.9 | 1,028.1 | 2,119.2 |
| Violent Crime | 81 | 180.7 | 110.1 | 359.0 |
| Murder | 3 | 6.7 | 1.0 | 5.0 |
| Robbery | 16 | 35.7 | 12.6 | 61.0 |
| Aggravated Assault | 44 | 98.2 | 62.8 | 256.0 |
| Property Crime | 551 | 1,229.2 | 918.0 | 1,760.0 |
| Burglary | 22 | 49.1 | 48.1 | 229.0 |
| Larceny | 477 | 1,064.1 | 805.4 | 1,272.0 |
| Car Theft | 52 | 116.0 | 64.4 | 259.0 |
Source: FBI Uniform Crime Reporting (2024)
Cost of living in Concord summary. We use data on the cost of living to determine how expensive it is to live in Concord. Real estate prices drive most of the variance in cost of living around New Hampshire. Key points include:
The cost of living in Concord is 110 with 100 being average.
The cost of living in Concord is 1.1x higher than the national average.
The median home value in Concord is $445,978.
The median income in Concord is $84,902.
Concord's Overall Cost Of Living
Higher Than The National Average
Cost Of Living In Concord Comparison Table
| Living Expense | Concord | New Hampshire | National Average |
|---|---|---|---|
| Overall | 110 | 111 | 100 |
| Services | 105 | 103 | 100 |
| Groceries | 106 | 105 | 100 |
| Health | 124 | 126 | 100 |
| Housing | 105 | 104 | 100 |
| Transportation | 104 | 108 | 100 |
| Utilities | 99 | 102 | 100 |
Source: Cost of living index, normalized to US average = 100
Concord, NH Weather
The average high in Concord is 57.4° and the average low is 35.6°.
There are 85.2 days of precipitation each year.
Expect an average of 43.8 inches of precipitation each year with 62.0 inches of snow.
| Stat | Concord |
|---|---|
| Average Annual High | 57.4 |
| Average Annual Low | 35.6 |
| Annual Precipitation Days | 85.2 |
| Average Annual Precipitation | 43.8 |
| Average Annual Snowfall | 62.0 |
Average High
Days of Rain
Source: NOAA climate normals (30-year)
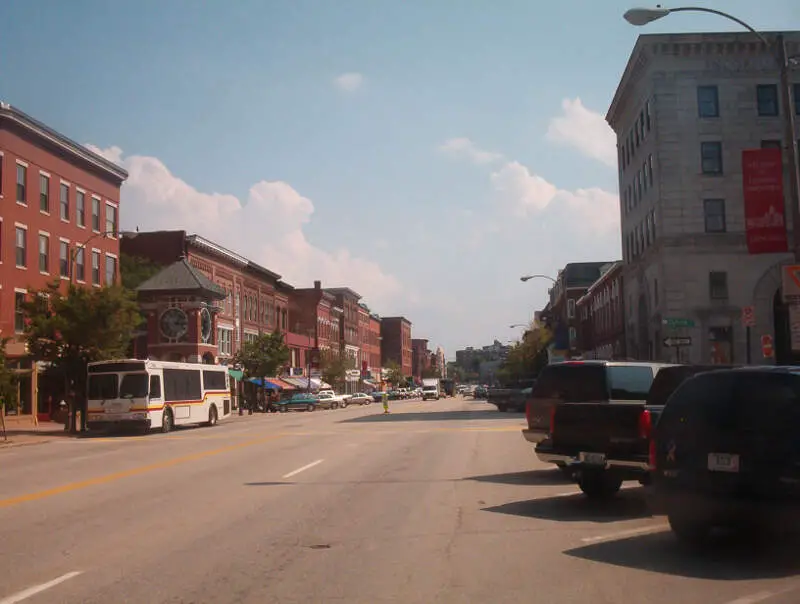
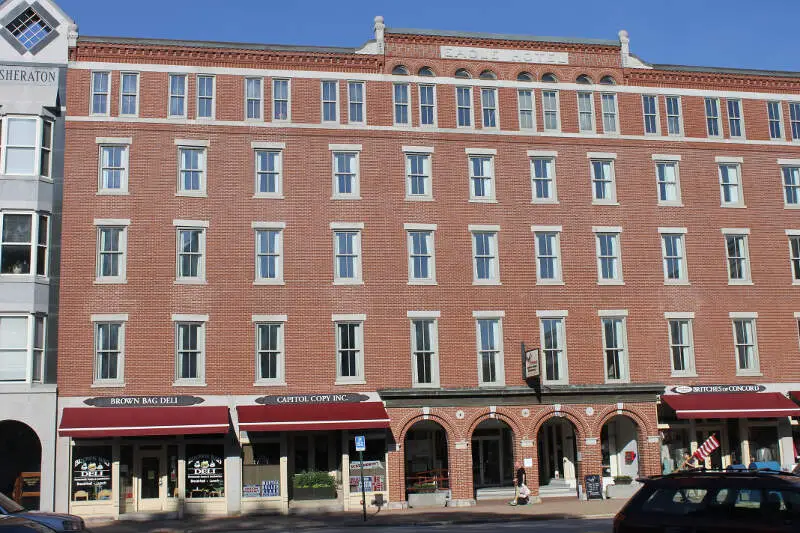
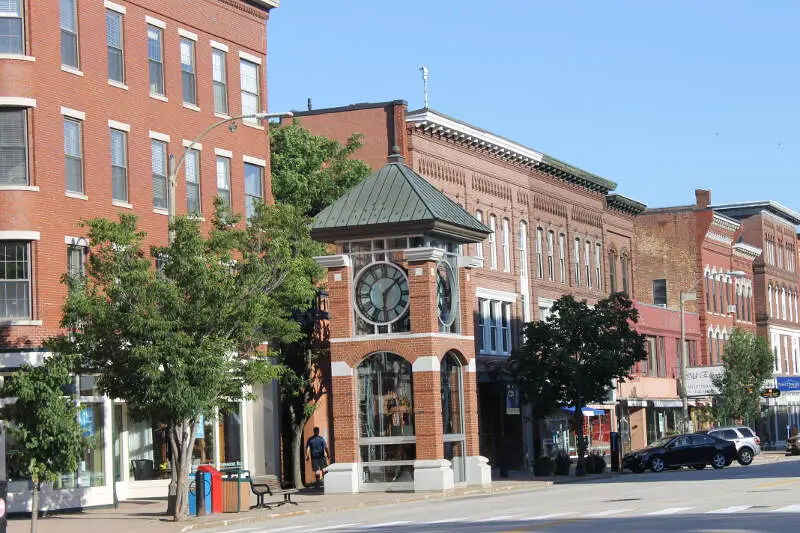
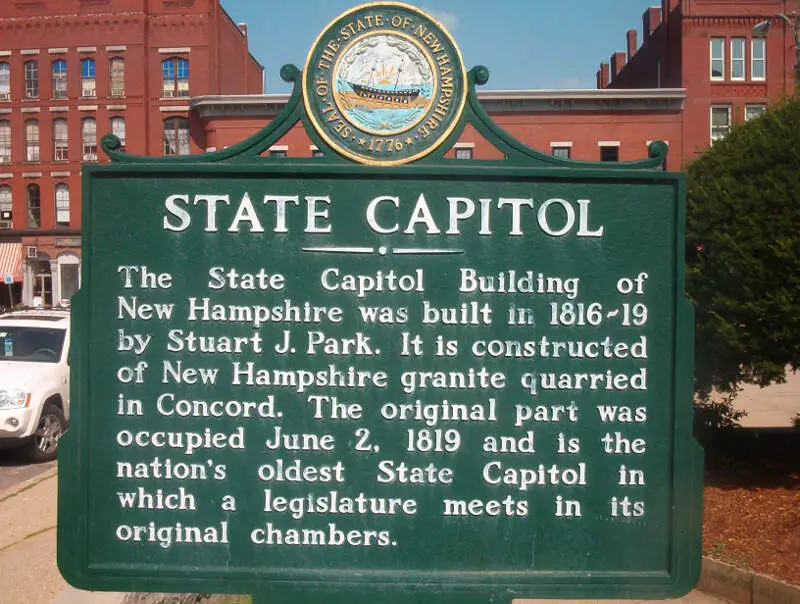
Concord, NH Photos


2 Reviews & Comments About Concord

Low crime, great schools, plenty of things to do year-round, great sense of community, good restaurants, theater and close to many recreational activities.
There were many lakes and public swimming pools nearby for summer activities, beautiful fall foliage and apple picking in the fall, lots of sledding, ice skating, and skiing in the winter
I grew up here and loved it. Unfortunately, I don't love the poverty, the ridiculous cost of heating, some of the most expensive universities in the U.S., the opioid epidemic, and lack of mental health care. I, like many of my generation got priced out of NH. If the U.S. starts taking care of its citizens again with the help of our neighbouring politician I reckon NH will return to its former glory.
Good: Fall, hiking, Market basket, coops, CSA
Rankings & Articles For Concord


Locations Around Concord
Map Of Concord, NH
Best Places Around Concord
South Hooksett, NH
Population 5,902
Manchester, NH
Population 115,643
Franklin, NH
Population 8,799
Concord Demographics And Statistics
Population over time in Concord
The current population in Concord is 44,375. The population has increased 3.3% from 2010.
| Year | Population | % Change |
|---|---|---|
| 2024 | 44,375 | 0.4% |
| 2023 | 44,219 | 0.4% |
| 2022 | 44,049 | 1.1% |
| 2021 | 43,552 | 0.1% |
| 2020 | 43,503 | 0.6% |
| 2019 | 43,244 | 0.5% |
| 2018 | 43,040 | 0.8% |
| 2017 | 42,717 | 0.2% |
| 2016 | 42,634 | 0.2% |
| 2015 | 42,537 | 0.1% |
| 2014 | 42,514 | -0.2% |
| 2013 | 42,590 | -0.4% |
| 2012 | 42,767 | -0.3% |
| 2011 | 42,886 | -0.2% |
| 2010 | 42,961 | - |
Race / Ethnicity in Concord
See the full breakdown
Concord is:
85.5% White with 37,929 White residents.
3.7% African American with 1,629 African American residents.
0.1% American Indian with 59 American Indian residents.
2.9% Asian with 1,300 Asian residents.
0.0% Hawaiian with 0 Hawaiian residents.
0.5% Other with 210 Other residents.
3.6% Two Or More with 1,595 Two Or More residents.
3.7% Hispanic with 1,653 Hispanic residents.
| Race | Concord | NH | USA |
|---|---|---|---|
| White | 85.5% | 86.9% | 57.4% |
| African American | 3.7% | 1.3% | 11.9% |
| American Indian | 0.1% | 0.1% | 0.5% |
| Asian | 2.9% | 2.6% | 5.9% |
| Hawaiian | 0.0% | 0.0% | 0.2% |
| Other | 0.5% | 0.4% | 0.6% |
| Two Or More | 3.6% | 4.0% | 4.3% |
| Hispanic | 3.7% | 4.7% | 19.3% |
Gender in Concord
See the full breakdown
Concord is 48.4% female with 21,460 female residents.
Concord is 51.6% male with 22,914 male residents.
| Gender | Concord | NH | USA |
|---|---|---|---|
| Female | 48.4% | 50.1% | 50.5% |
| Male | 51.6% | 49.9% | 49.5% |
Highest level of educational attainment in Concord for adults over 25
See the full breakdown
1.0% of adults in Concord completed < 9th grade.
4.0% of adults in Concord completed 9-12th grade.
26.0% of adults in Concord completed high school / ged.
16.0% of adults in Concord completed some college.
9.0% of adults in Concord completed associate's degree.
24.0% of adults in Concord completed bachelor's degree.
14.0% of adults in Concord completed master's degree.
4.0% of adults in Concord completed professional degree.
2.0% of adults in Concord completed doctorate degree.
| Education | Concord | NH | USA |
|---|---|---|---|
| < 9th Grade | 1.0% | 2.0% | 4.0% |
| 9-12th Grade | 4.0% | 4.0% | 6.0% |
| High School / GED | 26.0% | 27.0% | 26.0% |
| Some College | 16.0% | 17.0% | 19.0% |
| Associate's Degree | 9.0% | 10.0% | 9.0% |
| Bachelor's Degree | 24.0% | 24.0% | 22.0% |
| Master's Degree | 14.0% | 12.0% | 10.0% |
| Professional Degree | 4.0% | 2.0% | 2.0% |
| Doctorate Degree | 2.0% | 2.0% | 2.0% |
Household Income For Concord, New Hampshire
See the full breakdown
3.5% of households in Concord earn Less than $10,000.
2.6% of households in Concord earn $10,000 to $14,999.
5.4% of households in Concord earn $15,000 to $24,999.
6.9% of households in Concord earn $25,000 to $34,999.
8.0% of households in Concord earn $35,000 to $49,999.
17.2% of households in Concord earn $50,000 to $74,999.
14.5% of households in Concord earn $75,000 to $99,999.
19.2% of households in Concord earn $100,000 to $149,999.
11.7% of households in Concord earn $150,000 to $199,999.
10.9% of households in Concord earn $200,000 or more.
| Income | Concord | NH | USA |
|---|---|---|---|
| Less than $10,000 | 3.5% | 3.2% | 5.0% |
| $10,000 to $14,999 | 2.6% | 2.3% | 3.4% |
| $15,000 to $24,999 | 5.4% | 4.9% | 6.3% |
| $25,000 to $34,999 | 6.9% | 5.3% | 6.6% |
| $35,000 to $49,999 | 8.0% | 8.1% | 10.1% |
| $50,000 to $74,999 | 17.2% | 14.3% | 15.5% |
| $75,000 to $99,999 | 14.5% | 12.4% | 12.6% |
| $100,000 to $149,999 | 19.2% | 20.0% | 17.5% |
| $150,000 to $199,999 | 11.7% | 12.7% | 9.6% |
| $200,000 or more | 10.9% | 16.8% | 13.4% |
Source: U.S. Census ACS 5-year estimates (2024)


