Manchester SnackAbility
Overall SnackAbility
Crime in Manchester summary. We use data from the FBI to determine the crime rates in Manchester. Key points include:
There were 2,291 total crimes in Manchester in the last reporting year.
The overall crime rate per 100,000 people in Manchester is 1,984.2 / 100k people.
The violent crime rate per 100,000 people in Manchester is 336.0 / 100k people.
The property crime rate per 100,000 people in Manchester is 1,648.1 / 100k people.
Overall, crime in Manchester is -6.37% below the national average.
Total Crimes
Below National Average
Crime In Manchester Comparison Table
| Statistic | Count Raw |
Manchester / 100k People |
New Hampshire / 100k People |
National / 100k People |
|---|---|---|---|---|
| Total Crimes Per 100K | 2,291 | 1,984.2 | 1,028.1 | 2,119.2 |
| Violent Crime | 388 | 336.0 | 110.1 | 359.0 |
| Murder | 2 | 1.7 | 1.0 | 5.0 |
| Robbery | 67 | 58.0 | 12.6 | 61.0 |
| Aggravated Assault | 259 | 224.3 | 62.8 | 256.0 |
| Property Crime | 1,903 | 1,648.1 | 918.0 | 1,760.0 |
| Burglary | 107 | 92.7 | 48.1 | 229.0 |
| Larceny | 1,622 | 1,404.8 | 805.4 | 1,272.0 |
| Car Theft | 174 | 150.7 | 64.4 | 259.0 |
Source: FBI Uniform Crime Reporting (2024)
Cost of living in Manchester summary. We use data on the cost of living to determine how expensive it is to live in Manchester. Real estate prices drive most of the variance in cost of living around New Hampshire. Key points include:
The cost of living in Manchester is 112 with 100 being average.
The cost of living in Manchester is 1.1x higher than the national average.
The median home value in Manchester is $435,333.
The median income in Manchester is $81,007.
Manchester's Overall Cost Of Living
Higher Than The National Average
Cost Of Living In Manchester Comparison Table
| Living Expense | Manchester | New Hampshire | National Average |
|---|---|---|---|
| Overall | 112 | 111 | 100 |
| Services | 100 | 103 | 100 |
| Groceries | 107 | 105 | 100 |
| Health | 127 | 126 | 100 |
| Housing | 109 | 104 | 100 |
| Transportation | 107 | 108 | 100 |
| Utilities | 103 | 102 | 100 |
Source: Cost of living index, normalized to US average = 100
Manchester, NH Weather
The average high in Manchester is 58.2° and the average low is 37.0°.
There are 79.8 days of precipitation each year.
Expect an average of 42.1 inches of precipitation each year with 58.9 inches of snow.
| Stat | Manchester |
|---|---|
| Average Annual High | 58.2 |
| Average Annual Low | 37.0 |
| Annual Precipitation Days | 79.8 |
| Average Annual Precipitation | 42.1 |
| Average Annual Snowfall | 58.9 |
Average High
Days of Rain
Source: NOAA climate normals (30-year)
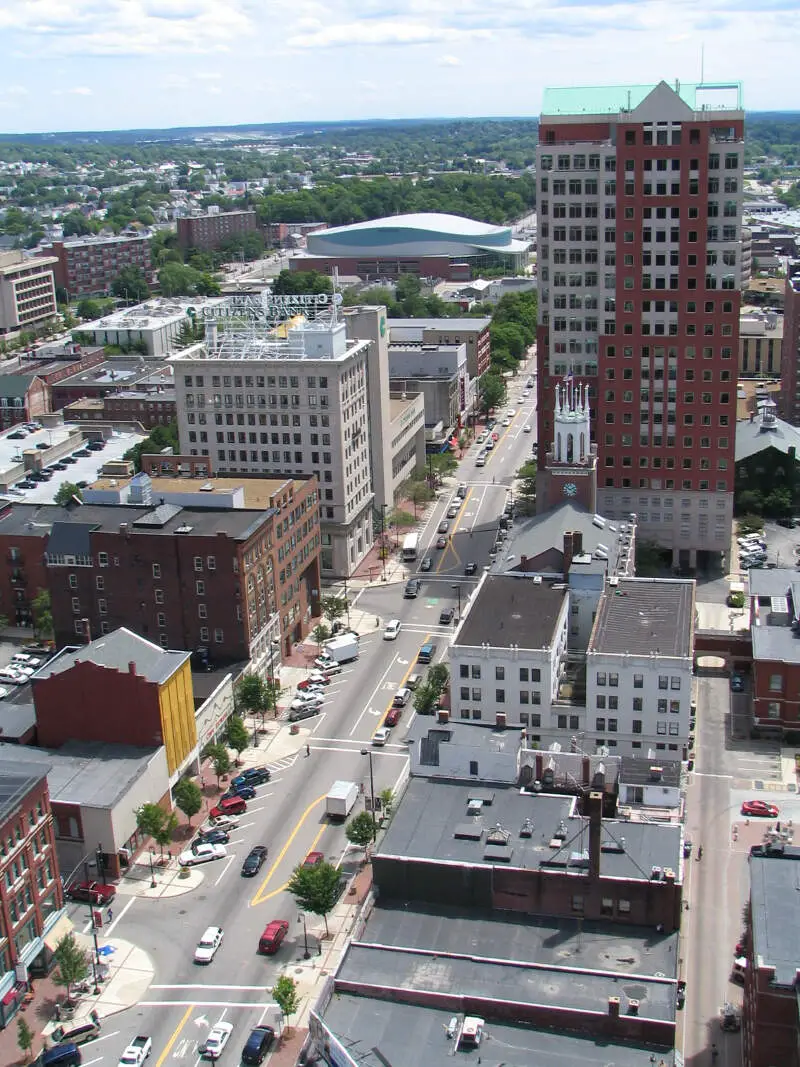
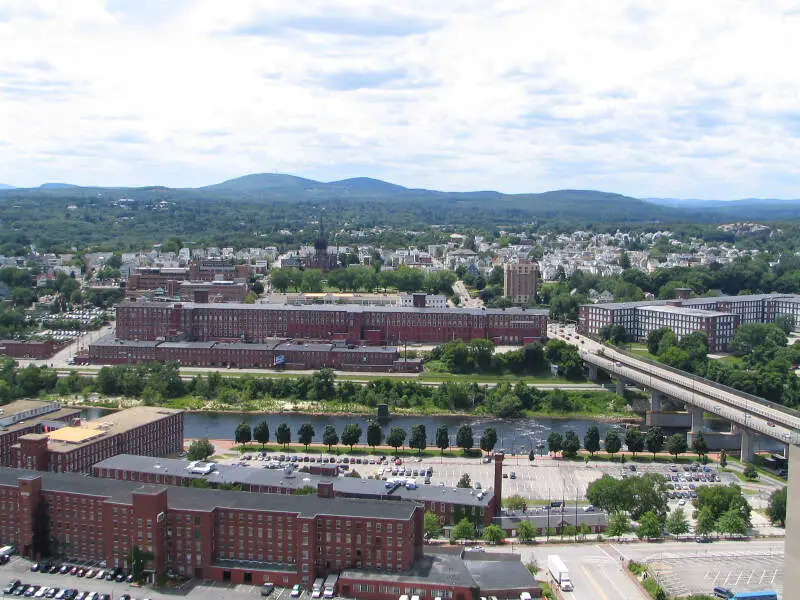
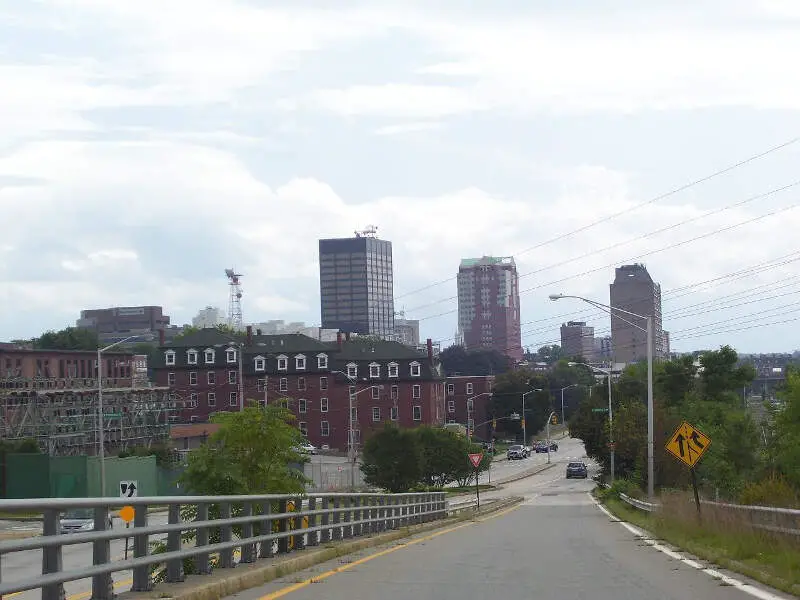
Manchester, NH Photos


2 Reviews & Comments About Manchester

The city of Manchester is a beautiful city. It has great places to eat and shop.
My favorite place is the Mall of NH. There are a lot of nice shops there. I also enjoy the downtown area.
The only bad I can say about New Hampshire is the winters can be brutal and the drug issues in the southern part of the state I will say that everyone I know who can work, does. No taxes unless you own a home or buy hot food, great restaurants, people are friendly but not so much so that it's annoying, and if you love hot winters but still love skiing, this is the state for you. It's a well balanced state and I can't imagine living in any other state.
Any place but Manchester is a beautiful and quaint place to live. Unfortunately there us a drug crisis going on in Manchester that has yet to be solved.
Rankings & Articles For Manchester


Locations Around Manchester
Map Of Manchester, NH
Best Places Around Manchester
South Hooksett, NH
Population 5,902
Londonderry, NH
Population 12,225
Hudson, NH
Population 7,469
Milford, NH
Population 8,956
Concord, NH
Population 44,375
Derry, NH
Population 21,339
Nashua, NH
Population 91,294
Manchester Demographics And Statistics
Population over time in Manchester
The current population in Manchester is 115,643. The population has increased 5.3% from 2010.
| Year | Population | % Change |
|---|---|---|
| 2024 | 115,643 | 0.2% |
| 2023 | 115,415 | 0.3% |
| 2022 | 115,037 | 0.3% |
| 2021 | 114,730 | 2.0% |
| 2020 | 112,441 | 0.3% |
| 2019 | 112,109 | 0.4% |
| 2018 | 111,657 | 1.0% |
| 2017 | 110,601 | 0.3% |
| 2016 | 110,231 | 0.1% |
| 2015 | 110,139 | 0.1% |
| 2014 | 110,065 | 0.1% |
| 2013 | 109,942 | 0.1% |
| 2012 | 109,786 | 0.0% |
| 2011 | 109,736 | -0.1% |
| 2010 | 109,791 | - |
Race / Ethnicity in Manchester
See the full breakdown
Manchester is:
72.3% White with 83,623 White residents.
4.2% African American with 4,861 African American residents.
0.1% American Indian with 76 American Indian residents.
4.1% Asian with 4,788 Asian residents.
0.0% Hawaiian with 25 Hawaiian residents.
0.5% Other with 561 Other residents.
5.0% Two Or More with 5,771 Two Or More residents.
13.8% Hispanic with 15,938 Hispanic residents.
| Race | Manchester | NH | USA |
|---|---|---|---|
| White | 72.3% | 86.9% | 57.4% |
| African American | 4.2% | 1.3% | 11.9% |
| American Indian | 0.1% | 0.1% | 0.5% |
| Asian | 4.1% | 2.6% | 5.9% |
| Hawaiian | 0.0% | 0.0% | 0.2% |
| Other | 0.5% | 0.4% | 0.6% |
| Two Or More | 5.0% | 4.0% | 4.3% |
| Hispanic | 13.8% | 4.7% | 19.3% |
Gender in Manchester
See the full breakdown
Manchester is 50.2% female with 58,008 female residents.
Manchester is 49.8% male with 57,635 male residents.
| Gender | Manchester | NH | USA |
|---|---|---|---|
| Female | 50.2% | 50.1% | 50.5% |
| Male | 49.8% | 49.9% | 49.5% |
Highest level of educational attainment in Manchester for adults over 25
See the full breakdown
4.0% of adults in Manchester completed < 9th grade.
6.0% of adults in Manchester completed 9-12th grade.
30.0% of adults in Manchester completed high school / ged.
18.0% of adults in Manchester completed some college.
8.0% of adults in Manchester completed associate's degree.
23.0% of adults in Manchester completed bachelor's degree.
9.0% of adults in Manchester completed master's degree.
1.0% of adults in Manchester completed professional degree.
1.0% of adults in Manchester completed doctorate degree.
| Education | Manchester | NH | USA |
|---|---|---|---|
| < 9th Grade | 4.0% | 2.0% | 4.0% |
| 9-12th Grade | 6.0% | 4.0% | 6.0% |
| High School / GED | 30.0% | 27.0% | 26.0% |
| Some College | 18.0% | 17.0% | 19.0% |
| Associate's Degree | 8.0% | 10.0% | 9.0% |
| Bachelor's Degree | 23.0% | 24.0% | 22.0% |
| Master's Degree | 9.0% | 12.0% | 10.0% |
| Professional Degree | 1.0% | 2.0% | 2.0% |
| Doctorate Degree | 1.0% | 2.0% | 2.0% |
Household Income For Manchester, New Hampshire
See the full breakdown
2.9% of households in Manchester earn Less than $10,000.
3.3% of households in Manchester earn $10,000 to $14,999.
6.6% of households in Manchester earn $15,000 to $24,999.
5.2% of households in Manchester earn $25,000 to $34,999.
10.4% of households in Manchester earn $35,000 to $49,999.
18.2% of households in Manchester earn $50,000 to $74,999.
14.4% of households in Manchester earn $75,000 to $99,999.
18.9% of households in Manchester earn $100,000 to $149,999.
10.7% of households in Manchester earn $150,000 to $199,999.
9.4% of households in Manchester earn $200,000 or more.
| Income | Manchester | NH | USA |
|---|---|---|---|
| Less than $10,000 | 2.9% | 3.2% | 5.0% |
| $10,000 to $14,999 | 3.3% | 2.3% | 3.4% |
| $15,000 to $24,999 | 6.6% | 4.9% | 6.3% |
| $25,000 to $34,999 | 5.2% | 5.3% | 6.6% |
| $35,000 to $49,999 | 10.4% | 8.1% | 10.1% |
| $50,000 to $74,999 | 18.2% | 14.3% | 15.5% |
| $75,000 to $99,999 | 14.4% | 12.4% | 12.6% |
| $100,000 to $149,999 | 18.9% | 20.0% | 17.5% |
| $150,000 to $199,999 | 10.7% | 12.7% | 9.6% |
| $200,000 or more | 9.4% | 16.8% | 13.4% |
Source: U.S. Census ACS 5-year estimates (2024)


