Albany SnackAbility
Overall SnackAbility
Crime in Albany summary. We use data from the FBI to determine the crime rates in Albany. Key points include:
There were 1,159 total crimes in Albany in the last reporting year.
The overall crime rate per 100,000 people in Albany is 2,027.0 / 100k people.
The violent crime rate per 100,000 people in Albany is 195.9 / 100k people.
The property crime rate per 100,000 people in Albany is 1,831.1 / 100k people.
Overall, crime in Albany is -4.35% below the national average.
Total Crimes
Below National Average
Crime In Albany Comparison Table
| Statistic | Count Raw |
Albany / 100k People |
Oregon / 100k People |
National / 100k People |
|---|---|---|---|---|
| Total Crimes Per 100K | 1,159 | 2,027.0 | 2,719.1 | 2,119.2 |
| Violent Crime | 112 | 195.9 | 331.0 | 359.0 |
| Murder | 0 | 0.0 | 3.7 | 5.0 |
| Robbery | 21 | 36.7 | 57.0 | 61.0 |
| Aggravated Assault | 69 | 120.7 | 229.1 | 256.0 |
| Property Crime | 1,047 | 1,831.1 | 2,388.0 | 1,760.0 |
| Burglary | 94 | 164.4 | 306.5 | 229.0 |
| Larceny | 905 | 1,582.7 | 1,789.5 | 1,272.0 |
| Car Theft | 48 | 83.9 | 292.1 | 259.0 |
Source: FBI Uniform Crime Reporting (2024)
Cost of living in Albany summary. We use data on the cost of living to determine how expensive it is to live in Albany. Real estate prices drive most of the variance in cost of living around Oregon. Key points include:
The cost of living in Albany is 112 with 100 being average.
The cost of living in Albany is 1.1x higher than the national average.
The median home value in Albany is $435,935.
The median income in Albany is $78,114.
Albany's Overall Cost Of Living
Higher Than The National Average
Cost Of Living In Albany Comparison Table
| Living Expense | Albany | Oregon | National Average |
|---|---|---|---|
| Overall | 112 | 109 | 100 |
| Services | 105 | 104 | 100 |
| Groceries | 105 | 106 | 100 |
| Health | 126 | 125 | 100 |
| Housing | 105 | 104 | 100 |
| Transportation | 107 | 106 | 100 |
| Utilities | 105 | 105 | 100 |
Source: Cost of living index, normalized to US average = 100
Albany, OR Weather
The average high in Albany is 63.1° and the average low is 42.6°.
There are 109.9 days of precipitation each year.
Expect an average of 41.8 inches of precipitation each year with 3.6 inches of snow.
| Stat | Albany |
|---|---|
| Average Annual High | 63.1 |
| Average Annual Low | 42.6 |
| Annual Precipitation Days | 109.9 |
| Average Annual Precipitation | 41.8 |
| Average Annual Snowfall | 3.6 |
Average High
Days of Rain
Source: NOAA climate normals (30-year)
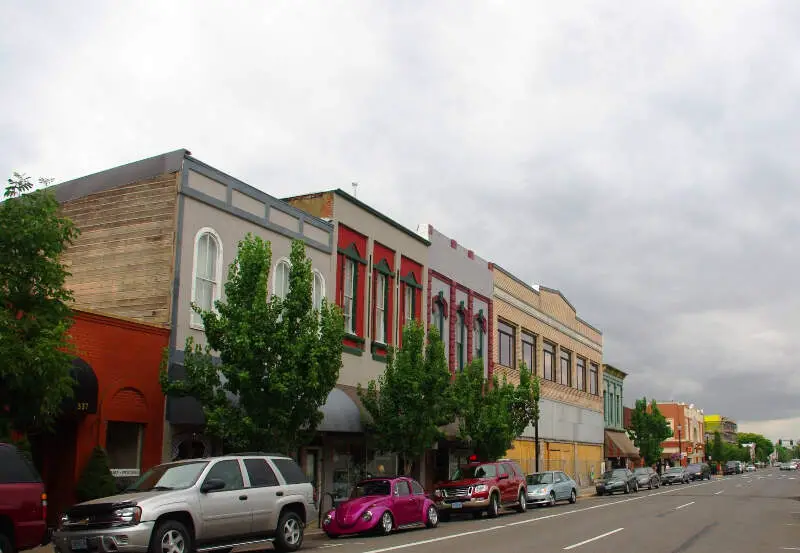
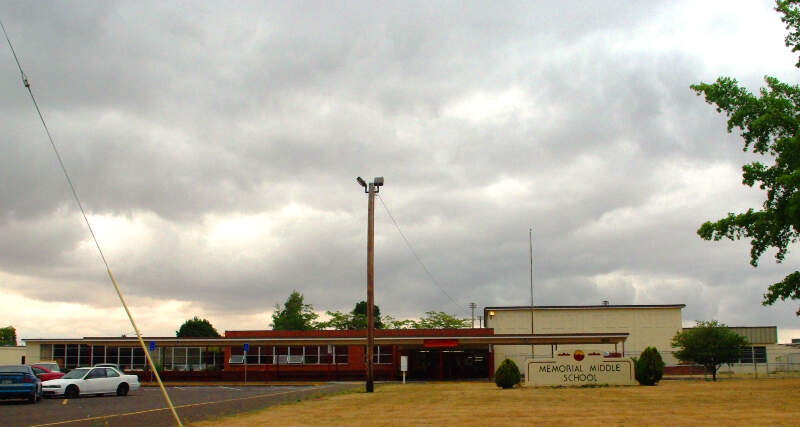
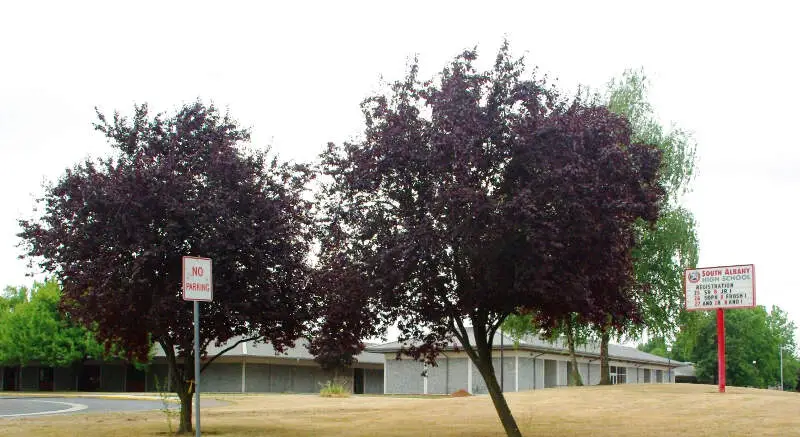
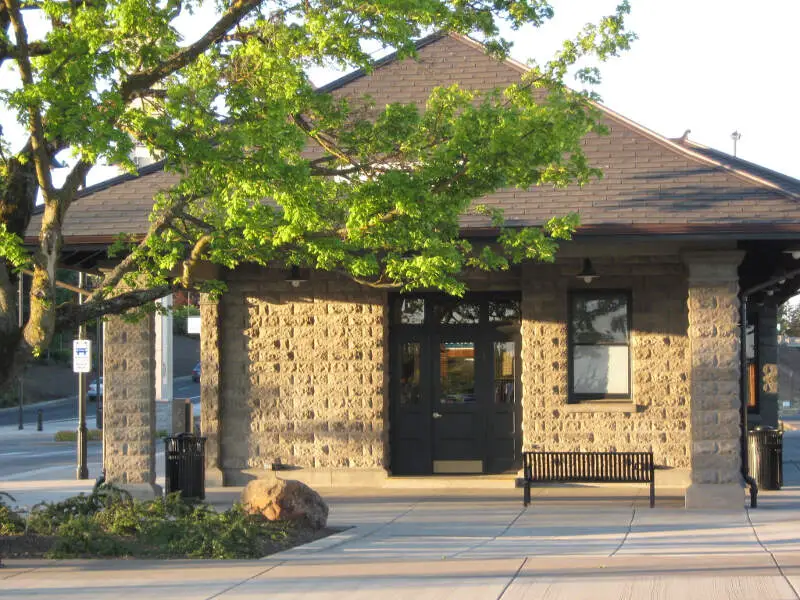
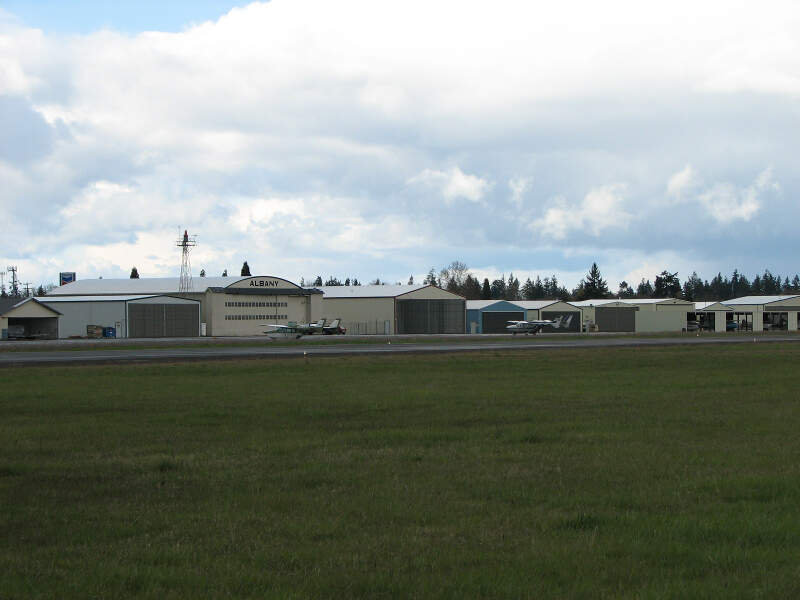
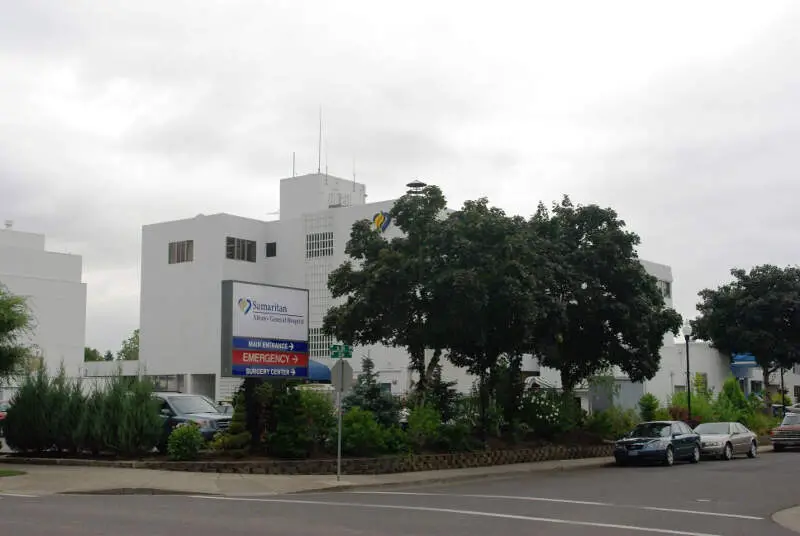
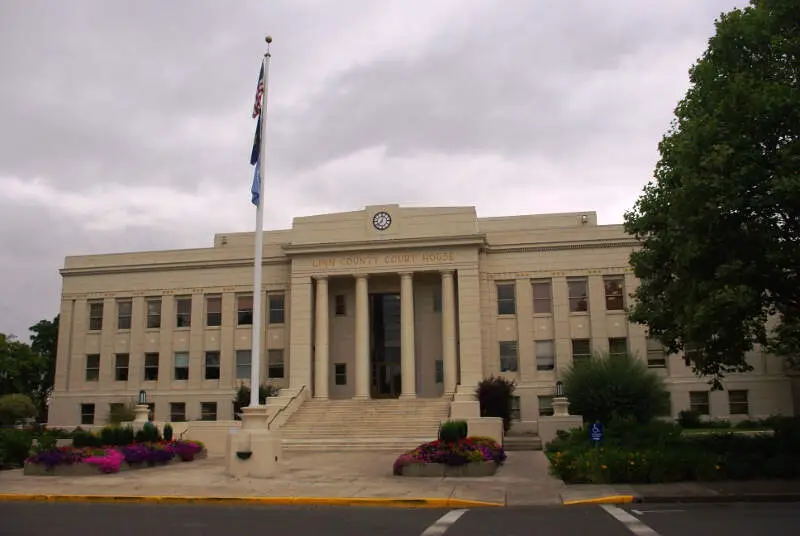
Albany, OR Photos

Rankings & Articles For Albany


Locations Around Albany
Map Of Albany, OR
Best Places Around Albany
Corvallis, OR
Population 59,960
Stayton, OR
Population 8,292
Independence, OR
Population 10,199
Monmouth, OR
Population 11,428
Lebanon, OR
Population 19,344
Albany Demographics And Statistics
Population over time in Albany
The current population in Albany is 56,839. The population has increased 17.0% from 2010.
| Year | Population | % Change |
|---|---|---|
| 2024 | 56,839 | 0.1% |
| 2023 | 56,773 | 0.8% |
| 2022 | 56,348 | 1.0% |
| 2021 | 55,776 | 2.5% |
| 2020 | 54,442 | 1.7% |
| 2019 | 53,521 | 1.5% |
| 2018 | 52,736 | 1.4% |
| 2017 | 52,007 | 0.2% |
| 2016 | 51,919 | 0.8% |
| 2015 | 51,511 | 0.6% |
| 2014 | 51,210 | 0.8% |
| 2013 | 50,828 | 1.2% |
| 2012 | 50,239 | 1.7% |
| 2011 | 49,407 | 1.7% |
| 2010 | 48,560 | - |
Race / Ethnicity in Albany
See the full breakdown
Albany is:
75.1% White with 42,692 White residents.
0.8% African American with 440 African American residents.
0.3% American Indian with 172 American Indian residents.
2.0% Asian with 1,142 Asian residents.
0.1% Hawaiian with 69 Hawaiian residents.
0.3% Other with 166 Other residents.
4.9% Two Or More with 2,768 Two Or More residents.
16.5% Hispanic with 9,390 Hispanic residents.
| Race | Albany | OR | USA |
|---|---|---|---|
| White | 75.1% | 71.4% | 57.4% |
| African American | 0.8% | 1.8% | 11.9% |
| American Indian | 0.3% | 0.6% | 0.5% |
| Asian | 2.0% | 4.4% | 5.9% |
| Hawaiian | 0.1% | 0.4% | 0.2% |
| Other | 0.3% | 0.6% | 0.6% |
| Two Or More | 4.9% | 6.1% | 4.3% |
| Hispanic | 16.5% | 14.7% | 19.3% |
Gender in Albany
See the full breakdown
Albany is 49.9% female with 28,344 female residents.
Albany is 50.1% male with 28,495 male residents.
| Gender | Albany | OR | USA |
|---|---|---|---|
| Female | 49.9% | 50.1% | 50.5% |
| Male | 50.1% | 49.9% | 49.5% |
Highest level of educational attainment in Albany for adults over 25
See the full breakdown
3.0% of adults in Albany completed < 9th grade.
4.0% of adults in Albany completed 9-12th grade.
23.0% of adults in Albany completed high school / ged.
29.0% of adults in Albany completed some college.
12.0% of adults in Albany completed associate's degree.
20.0% of adults in Albany completed bachelor's degree.
7.0% of adults in Albany completed master's degree.
1.0% of adults in Albany completed professional degree.
1.0% of adults in Albany completed doctorate degree.
| Education | Albany | OR | USA |
|---|---|---|---|
| < 9th Grade | 3.0% | 3.0% | 4.0% |
| 9-12th Grade | 4.0% | 5.0% | 6.0% |
| High School / GED | 23.0% | 22.0% | 26.0% |
| Some College | 29.0% | 24.0% | 19.0% |
| Associate's Degree | 12.0% | 9.0% | 9.0% |
| Bachelor's Degree | 20.0% | 23.0% | 22.0% |
| Master's Degree | 7.0% | 10.0% | 10.0% |
| Professional Degree | 1.0% | 2.0% | 2.0% |
| Doctorate Degree | 1.0% | 2.0% | 2.0% |
Household Income For Albany, Oregon
See the full breakdown
4.2% of households in Albany earn Less than $10,000.
2.1% of households in Albany earn $10,000 to $14,999.
6.4% of households in Albany earn $15,000 to $24,999.
8.4% of households in Albany earn $25,000 to $34,999.
10.2% of households in Albany earn $35,000 to $49,999.
16.9% of households in Albany earn $50,000 to $74,999.
15.3% of households in Albany earn $75,000 to $99,999.
19.6% of households in Albany earn $100,000 to $149,999.
9.9% of households in Albany earn $150,000 to $199,999.
7.0% of households in Albany earn $200,000 or more.
| Income | Albany | OR | USA |
|---|---|---|---|
| Less than $10,000 | 4.2% | 4.5% | 5.0% |
| $10,000 to $14,999 | 2.1% | 3.2% | 3.4% |
| $15,000 to $24,999 | 6.4% | 6.1% | 6.3% |
| $25,000 to $34,999 | 8.4% | 6.2% | 6.6% |
| $35,000 to $49,999 | 10.2% | 10.0% | 10.1% |
| $50,000 to $74,999 | 16.9% | 15.4% | 15.5% |
| $75,000 to $99,999 | 15.3% | 13.2% | 12.6% |
| $100,000 to $149,999 | 19.6% | 18.5% | 17.5% |
| $150,000 to $199,999 | 9.9% | 10.1% | 9.6% |
| $200,000 or more | 7.0% | 12.7% | 13.4% |
Source: U.S. Census ACS 5-year estimates (2024)


