Hood River SnackAbility
Overall SnackAbility
Crime in Hood River summary. We use data from the FBI to determine the crime rates in Hood River. Key points include:
There were 200 total crimes in Hood River in the last reporting year.
The overall crime rate per 100,000 people in Hood River is 2,398.1 / 100k people.
The violent crime rate per 100,000 people in Hood River is 131.9 / 100k people.
The property crime rate per 100,000 people in Hood River is 2,266.2 / 100k people.
Overall, crime in Hood River is 13.16% above the national average.
Total Crimes
Above National Average
Crime In Hood River Comparison Table
| Statistic | Count Raw |
Hood River / 100k People |
Oregon / 100k People |
National / 100k People |
|---|---|---|---|---|
| Total Crimes Per 100K | 200 | 2,398.1 | 2,719.1 | 2,119.2 |
| Violent Crime | 11 | 131.9 | 331.0 | 359.0 |
| Murder | 0 | 0.0 | 3.7 | 5.0 |
| Robbery | 2 | 24.0 | 57.0 | 61.0 |
| Aggravated Assault | 7 | 83.9 | 229.1 | 256.0 |
| Property Crime | 189 | 2,266.2 | 2,388.0 | 1,760.0 |
| Burglary | 8 | 95.9 | 306.5 | 229.0 |
| Larceny | 172 | 2,062.4 | 1,789.5 | 1,272.0 |
| Car Theft | 9 | 107.9 | 292.1 | 259.0 |
Source: FBI Uniform Crime Reporting (2024)
Cost of living in Hood River summary. We use data on the cost of living to determine how expensive it is to live in Hood River. Real estate prices drive most of the variance in cost of living around Oregon. Key points include:
The cost of living in Hood River is 134 with 100 being average.
The cost of living in Hood River is 1.3x higher than the national average.
The median home value in Hood River is $712,509.
The median income in Hood River is $85,647.
Hood River's Overall Cost Of Living
Higher Than The National Average
Cost Of Living In Hood River Comparison Table
| Living Expense | Hood River | Oregon | National Average |
|---|---|---|---|
| Overall | 134 | 109 | 100 |
| Services | 105 | 104 | 100 |
| Groceries | 106 | 106 | 100 |
| Health | 190 | 125 | 100 |
| Housing | 106 | 104 | 100 |
| Transportation | 110 | 106 | 100 |
| Utilities | 104 | 105 | 100 |
Source: Cost of living index, normalized to US average = 100
Hood River, OR Weather
The average high in Hood River is 61.5° and the average low is 40.8°.
There are 98.8 days of precipitation each year.
Expect an average of 28.8 inches of precipitation each year with 27.2 inches of snow.
| Stat | Hood River |
|---|---|
| Average Annual High | 61.5 |
| Average Annual Low | 40.8 |
| Annual Precipitation Days | 98.8 |
| Average Annual Precipitation | 28.8 |
| Average Annual Snowfall | 27.2 |
Average High
Days of Rain
Source: NOAA climate normals (30-year)
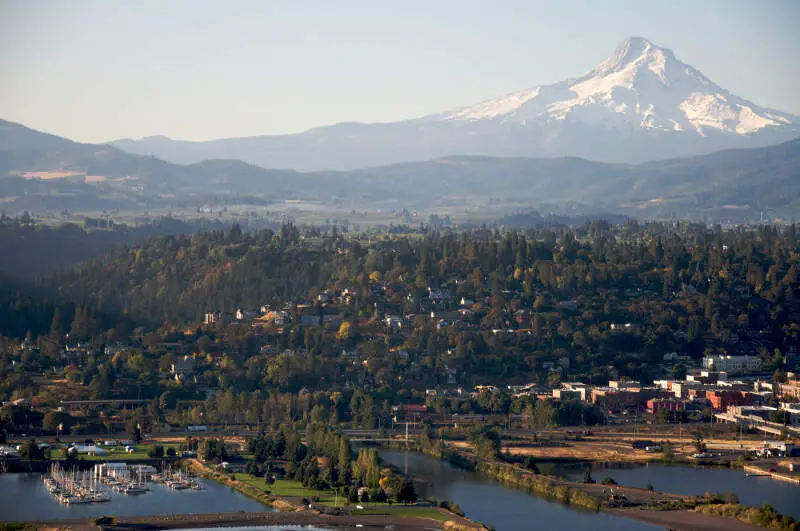
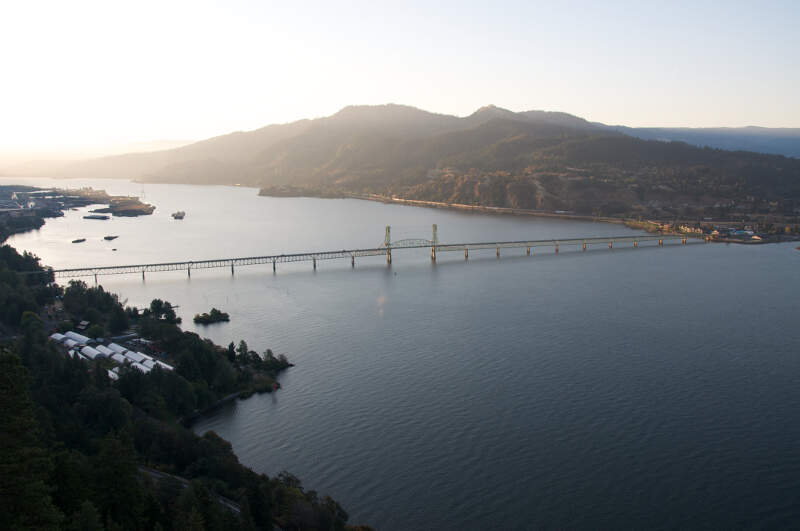
Hood River, OR Photos
1 Reviews & Comments About Hood River

A great small town feel overlooking the Columbia River Gorge. Beautiful and peaceful.
Lots of farms and fresh/local fruit and orchards. Super quaint B&B places to stay.
Rankings & Articles For Hood River


Locations Around Hood River
Map Of Hood River, OR
Best Places Around Hood River
Washougal, WA
Population 17,490
Battle Ground, WA
Population 21,886
Camas, WA
Population 27,007
Orchards, WA
Population 29,438
Troutdale, OR
Population 15,923
The Dalles, OR
Population 15,917
Fairview, OR
Population 10,735
Gresham, OR
Population 112,378
Sandy, OR
Population 12,854
Hood River Demographics And Statistics
Population over time in Hood River
The current population in Hood River is 8,361. The population has increased 21.6% from 2010.
| Year | Population | % Change |
|---|---|---|
| 2024 | 8,361 | 0.0% |
| 2023 | 8,360 | 0.8% |
| 2022 | 8,292 | 1.0% |
| 2021 | 8,210 | 6.0% |
| 2020 | 7,745 | 0.4% |
| 2019 | 7,715 | 0.4% |
| 2018 | 7,688 | 2.2% |
| 2017 | 7,526 | 0.7% |
| 2016 | 7,476 | 0.9% |
| 2015 | 7,412 | 1.4% |
| 2014 | 7,311 | 1.3% |
| 2013 | 7,214 | 1.4% |
| 2012 | 7,115 | 1.9% |
| 2011 | 6,985 | 1.6% |
| 2010 | 6,878 | - |
Race / Ethnicity in Hood River
See the full breakdown
Hood River is:
65.2% White with 5,452 White residents.
0.7% African American with 59 African American residents.
0.1% American Indian with 11 American Indian residents.
1.2% Asian with 102 Asian residents.
0.4% Hawaiian with 33 Hawaiian residents.
1.5% Other with 127 Other residents.
7.7% Two Or More with 643 Two Or More residents.
23.1% Hispanic with 1,934 Hispanic residents.
| Race | Hood River | OR | USA |
|---|---|---|---|
| White | 65.2% | 71.4% | 57.4% |
| African American | 0.7% | 1.8% | 11.9% |
| American Indian | 0.1% | 0.6% | 0.5% |
| Asian | 1.2% | 4.4% | 5.9% |
| Hawaiian | 0.4% | 0.4% | 0.2% |
| Other | 1.5% | 0.6% | 0.6% |
| Two Or More | 7.7% | 6.1% | 4.3% |
| Hispanic | 23.1% | 14.7% | 19.3% |
Gender in Hood River
See the full breakdown
Hood River is 51.4% female with 4,297 female residents.
Hood River is 48.6% male with 4,063 male residents.
| Gender | Hood River | OR | USA |
|---|---|---|---|
| Female | 51.4% | 50.1% | 50.5% |
| Male | 48.6% | 49.9% | 49.5% |
Highest level of educational attainment in Hood River for adults over 25
See the full breakdown
6.0% of adults in Hood River completed < 9th grade.
4.0% of adults in Hood River completed 9-12th grade.
14.0% of adults in Hood River completed high school / ged.
16.0% of adults in Hood River completed some college.
5.0% of adults in Hood River completed associate's degree.
30.0% of adults in Hood River completed bachelor's degree.
18.0% of adults in Hood River completed master's degree.
5.0% of adults in Hood River completed professional degree.
2.0% of adults in Hood River completed doctorate degree.
| Education | Hood River | OR | USA |
|---|---|---|---|
| < 9th Grade | 6.0% | 3.0% | 4.0% |
| 9-12th Grade | 4.0% | 5.0% | 6.0% |
| High School / GED | 14.0% | 22.0% | 26.0% |
| Some College | 16.0% | 24.0% | 19.0% |
| Associate's Degree | 5.0% | 9.0% | 9.0% |
| Bachelor's Degree | 30.0% | 23.0% | 22.0% |
| Master's Degree | 18.0% | 10.0% | 10.0% |
| Professional Degree | 5.0% | 2.0% | 2.0% |
| Doctorate Degree | 2.0% | 2.0% | 2.0% |
Household Income For Hood River, Oregon
See the full breakdown
5.7% of households in Hood River earn Less than $10,000.
4.6% of households in Hood River earn $10,000 to $14,999.
5.1% of households in Hood River earn $15,000 to $24,999.
7.0% of households in Hood River earn $25,000 to $34,999.
7.1% of households in Hood River earn $35,000 to $49,999.
14.8% of households in Hood River earn $50,000 to $74,999.
11.2% of households in Hood River earn $75,000 to $99,999.
14.4% of households in Hood River earn $100,000 to $149,999.
10.1% of households in Hood River earn $150,000 to $199,999.
19.9% of households in Hood River earn $200,000 or more.
| Income | Hood River | OR | USA |
|---|---|---|---|
| Less than $10,000 | 5.7% | 4.5% | 5.0% |
| $10,000 to $14,999 | 4.6% | 3.2% | 3.4% |
| $15,000 to $24,999 | 5.1% | 6.1% | 6.3% |
| $25,000 to $34,999 | 7.0% | 6.2% | 6.6% |
| $35,000 to $49,999 | 7.1% | 10.0% | 10.1% |
| $50,000 to $74,999 | 14.8% | 15.4% | 15.5% |
| $75,000 to $99,999 | 11.2% | 13.2% | 12.6% |
| $100,000 to $149,999 | 14.4% | 18.5% | 17.5% |
| $150,000 to $199,999 | 10.1% | 10.1% | 9.6% |
| $200,000 or more | 19.9% | 12.7% | 13.4% |
Source: U.S. Census ACS 5-year estimates (2024)


