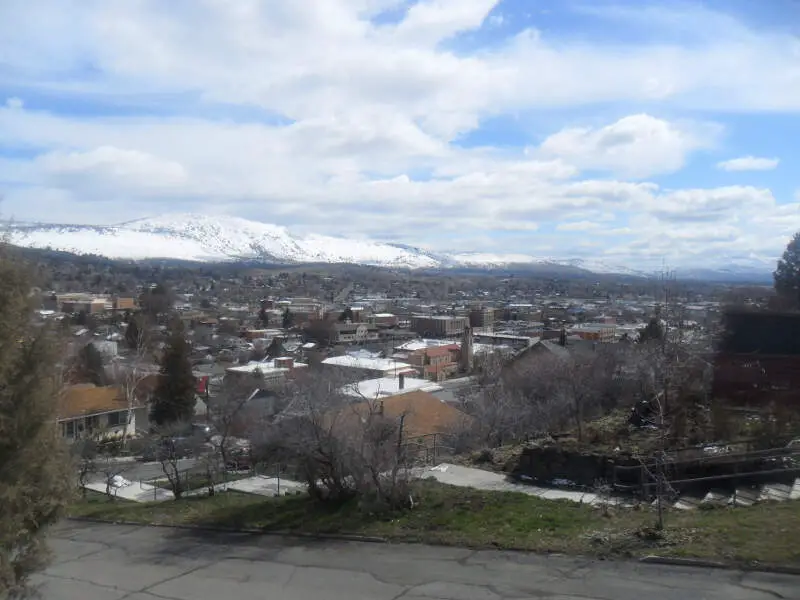
Klamath Falls, OR
Demographics And Statistics
Living In Klamath Falls, Oregon Summary
Life in Klamath Falls research summary. HomeSnacks has been using Saturday Night Science to research the quality of life in Klamath Falls over the past nine years using Census, FBI, Zillow, and other primary data sources. Based on the most recently available data, we found the following about life in Klamath Falls:
The population in Klamath Falls is 21,879.
The median home value in Klamath Falls is $305,251.
The median income in Klamath Falls is $47,268.
The cost of living in Klamath Falls is 100 which is 1.0x lower than the national average.
The median rent in Klamath Falls is $962.
The unemployment rate in Klamath Falls is 10.5%.
The poverty rate in Klamath Falls is 23.2%.
The average high in Klamath Falls is 59.4° and the average low is 32.0°.
Klamath Falls SnackAbility
Overall SnackAbility
Klamath Falls, OR Crime Report
Crime in Klamath Falls summary. We use data from the FBI to determine the crime rates in Klamath Falls. Key points include:
There were 695 total crimes in Klamath Falls in the last reporting year.
The overall crime rate per 100,000 people in Klamath Falls is 3,171.9 / 100k people.
The violent crime rate per 100,000 people in Klamath Falls is 483.8 / 100k people.
The property crime rate per 100,000 people in Klamath Falls is 2,688.1 / 100k people.
Overall, crime in Klamath Falls is 49.67% above the national average.
Total Crimes
Above National Average
Crime In Klamath Falls Comparison Table
| Statistic | Count Raw |
Klamath Falls / 100k People |
Oregon / 100k People |
National / 100k People |
|---|---|---|---|---|
| Total Crimes Per 100K | 695 | 3,171.9 | 2,719.1 | 2,119.2 |
| Violent Crime | 106 | 483.8 | 331.0 | 359.0 |
| Murder | 3 | 13.7 | 3.7 | 5.0 |
| Robbery | 18 | 82.2 | 57.0 | 61.0 |
| Aggravated Assault | 71 | 324.0 | 229.1 | 256.0 |
| Property Crime | 589 | 2,688.1 | 2,388.0 | 1,760.0 |
| Burglary | 77 | 351.4 | 306.5 | 229.0 |
| Larceny | 407 | 1,857.5 | 1,789.5 | 1,272.0 |
| Car Theft | 105 | 479.2 | 292.1 | 259.0 |
Klamath Falls, OR Cost Of Living
Cost of living in Klamath Falls summary. We use data on the cost of living to determine how expensive it is to live in Klamath Falls. Real estate prices drive most of the variance in cost of living around Oregon. Key points include:
The cost of living in Klamath Falls is 100 with 100 being average.
The cost of living in Klamath Falls is 1.0x lower than the national average.
The median home value in Klamath Falls is $305,251.
The median income in Klamath Falls is $47,268.
Klamath Falls's Overall Cost Of Living
Lower Than The National Average
Cost Of Living In Klamath Falls Comparison Table
| Living Expense | Klamath Falls | Oregon | National Average | |
|---|---|---|---|---|
| Overall | 100 | 112 | 100 | |
| Services | 105 | 107 | 100 | |
| Groceries | 108 | 107 | 100 | |
| Health | 103 | 104 | 100 | |
| Housing | 94 | 124 | 100 | |
| Transportation | 106 | 116 | 100 | |
| Utilities | 94 | 97 | 100 | |
Klamath Falls, OR Weather
The average high in Klamath Falls is 59.4° and the average low is 32.0°.
There are 80.4 days of precipitation each year.
Expect an average of 15.0 inches of precipitation each year with 35.3 inches of snow.
| Stat | Klamath Falls |
|---|---|
| Average Annual High | 59.4 |
| Average Annual Low | 32.0 |
| Annual Precipitation Days | 80.4 |
| Average Annual Precipitation | 15.0 |
| Average Annual Snowfall | 35.3 |
Average High
Days of Rain
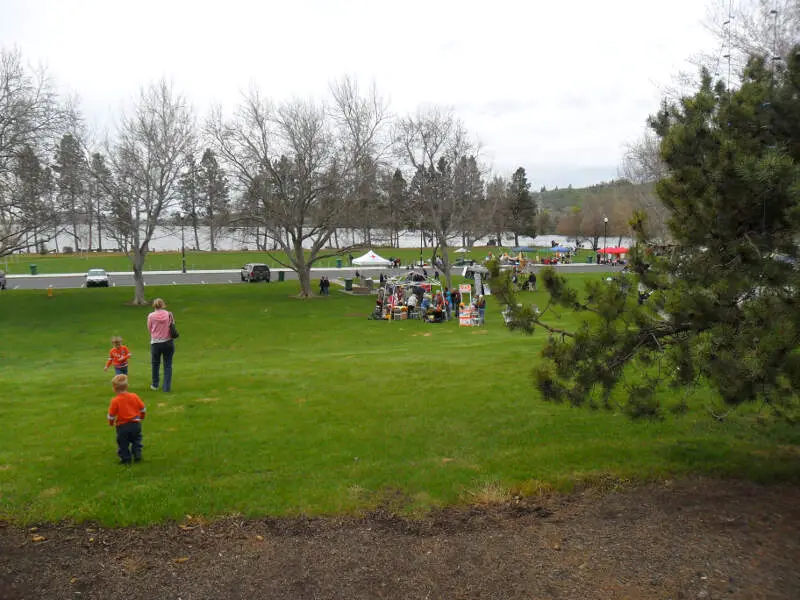
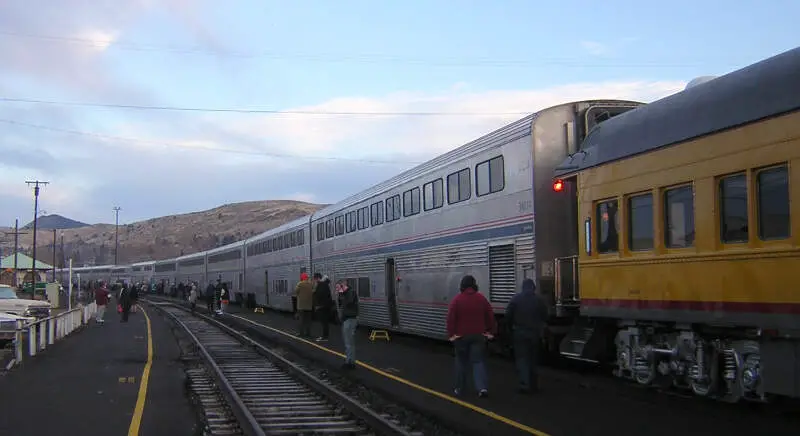
Klamath Falls, OR Photos

1 Reviews & Comments About Klamath Falls
/5

HomeSnacks User - None
Klamath Falls and Altamont can be combined since residents there see themselves as all being from Klamath Falls. That would probably put them in the top 10.
Rankings for Klamath Falls in Oregon


Locations Around Klamath Falls
Map Of Klamath Falls, OR
Klamath Falls Demographics And Statistics
Population over time in Klamath Falls
The current population in Klamath Falls is 21,879. The population has increased 4.8% from 2010.
| Year | Population | % Change |
|---|---|---|
| 2023 | 21,879 | 0.3% |
| 2022 | 21,806 | 0.4% |
| 2021 | 21,710 | 0.9% |
| 2020 | 21,509 | 0.8% |
| 2019 | 21,335 | 0.9% |
| 2018 | 21,138 | 0.1% |
| 2017 | 21,113 | -1.0% |
| 2016 | 21,322 | 0.3% |
| 2015 | 21,261 | 0.5% |
| 2014 | 21,165 | 0.7% |
| 2013 | 21,026 | 0.4% |
| 2012 | 20,943 | 0.3% |
| 2011 | 20,881 | 0.1% |
| 2010 | 20,869 | - |
Race / Ethnicity in Klamath Falls
Klamath Falls is:
71.0% White with 15,537 White residents.
0.7% African American with 157 African American residents.
1.6% American Indian with 354 American Indian residents.
1.2% Asian with 266 Asian residents.
0.5% Hawaiian with 112 Hawaiian residents.
0.5% Other with 100 Other residents.
8.8% Two Or More with 1,916 Two Or More residents.
15.7% Hispanic with 3,437 Hispanic residents.
| Race | Klamath Falls | OR | USA |
|---|---|---|---|
| White | 71.0% | 72.3% | 58.2% |
| African American | 0.7% | 1.8% | 12.0% |
| American Indian | 1.6% | 0.7% | 0.5% |
| Asian | 1.2% | 4.4% | 5.7% |
| Hawaiian | 0.5% | 0.4% | 0.2% |
| Other | 0.5% | 0.5% | 0.5% |
| Two Or More | 8.8% | 5.6% | 3.9% |
| Hispanic | 15.7% | 14.3% | 19.0% |
Gender in Klamath Falls
Klamath Falls is 49.7% female with 10,884 female residents.
Klamath Falls is 50.3% male with 10,995 male residents.
| Gender | Klamath Falls | OR | USA |
|---|---|---|---|
| Female | 49.7% | 50.1% | 50.5% |
| Male | 50.3% | 49.9% | 49.5% |
Highest level of educational attainment in Klamath Falls for adults over 25
5.0% of adults in Klamath Falls completed < 9th grade.
7.0% of adults in Klamath Falls completed 9-12th grade.
30.0% of adults in Klamath Falls completed high school / ged.
27.0% of adults in Klamath Falls completed some college.
9.0% of adults in Klamath Falls completed associate's degree.
11.0% of adults in Klamath Falls completed bachelor's degree.
9.0% of adults in Klamath Falls completed master's degree.
1.0% of adults in Klamath Falls completed professional degree.
1.0% of adults in Klamath Falls completed doctorate degree.
| Education | Klamath Falls | OR | USA |
|---|---|---|---|
| < 9th Grade | 5.0% | 4.0% | 5.0% |
| 9-12th Grade | 7.0% | 5.0% | 6.0% |
| High School / GED | 30.0% | 22.0% | 26.0% |
| Some College | 27.0% | 24.0% | 19.0% |
| Associate's Degree | 9.0% | 9.0% | 9.0% |
| Bachelor's Degree | 11.0% | 22.0% | 21.0% |
| Master's Degree | 9.0% | 10.0% | 10.0% |
| Professional Degree | 1.0% | 2.0% | 2.0% |
| Doctorate Degree | 1.0% | 2.0% | 2.0% |
Household Income For Klamath Falls, Oregon
11.5% of households in Klamath Falls earn Less than $10,000.
8.0% of households in Klamath Falls earn $10,000 to $14,999.
10.8% of households in Klamath Falls earn $15,000 to $24,999.
7.7% of households in Klamath Falls earn $25,000 to $34,999.
13.0% of households in Klamath Falls earn $35,000 to $49,999.
16.2% of households in Klamath Falls earn $50,000 to $74,999.
13.7% of households in Klamath Falls earn $75,000 to $99,999.
10.8% of households in Klamath Falls earn $100,000 to $149,999.
3.4% of households in Klamath Falls earn $150,000 to $199,999.
5.0% of households in Klamath Falls earn $200,000 or more.
| Income | Klamath Falls | OR | USA |
|---|---|---|---|
| Less than $10,000 | 11.5% | 4.4% | 4.9% |
| $10,000 to $14,999 | 8.0% | 3.4% | 3.6% |
| $15,000 to $24,999 | 10.8% | 6.3% | 6.6% |
| $25,000 to $34,999 | 7.7% | 6.4% | 6.8% |
| $35,000 to $49,999 | 13.0% | 10.5% | 10.4% |
| $50,000 to $74,999 | 16.2% | 15.9% | 15.7% |
| $75,000 to $99,999 | 13.7% | 13.3% | 12.7% |
| $100,000 to $149,999 | 10.8% | 18.5% | 17.4% |
| $150,000 to $199,999 | 3.4% | 9.6% | 9.3% |
| $200,000 or more | 5.0% | 11.8% | 12.6% |


