Prineville SnackAbility
Overall SnackAbility
Crime in Prineville summary. We use data from the FBI to determine the crime rates in Prineville. Key points include:
There were 117 total crimes in Prineville in the last reporting year.
The overall crime rate per 100,000 people in Prineville is 971.2 / 100k people.
The violent crime rate per 100,000 people in Prineville is 240.7 / 100k people.
The property crime rate per 100,000 people in Prineville is 730.5 / 100k people.
Overall, crime in Prineville is -54.17% below the national average.
Total Crimes
Below National Average
Crime In Prineville Comparison Table
| Statistic | Count Raw |
Prineville / 100k People |
Oregon / 100k People |
National / 100k People |
|---|---|---|---|---|
| Total Crimes Per 100K | 117 | 971.2 | 2,719.1 | 2,119.2 |
| Violent Crime | 29 | 240.7 | 331.0 | 359.0 |
| Murder | 0 | 0.0 | 3.7 | 5.0 |
| Robbery | 0 | 0.0 | 57.0 | 61.0 |
| Aggravated Assault | 24 | 199.2 | 229.1 | 256.0 |
| Property Crime | 88 | 730.5 | 2,388.0 | 1,760.0 |
| Burglary | 6 | 49.8 | 306.5 | 229.0 |
| Larceny | 74 | 614.3 | 1,789.5 | 1,272.0 |
| Car Theft | 8 | 66.4 | 292.1 | 259.0 |
Source: FBI Uniform Crime Reporting (2024)
Cost of living in Prineville summary. We use data on the cost of living to determine how expensive it is to live in Prineville. Real estate prices drive most of the variance in cost of living around Oregon. Key points include:
The cost of living in Prineville is 106 with 100 being average.
The cost of living in Prineville is 1.1x higher than the national average.
The median home value in Prineville is $425,758.
The median income in Prineville is $72,980.
Prineville's Overall Cost Of Living
Higher Than The National Average
Cost Of Living In Prineville Comparison Table
| Living Expense | Prineville | Oregon | National Average |
|---|---|---|---|
| Overall | 106 | 109 | 100 |
| Services | 104 | 104 | 100 |
| Groceries | 102 | 106 | 100 |
| Health | 104 | 125 | 100 |
| Housing | 106 | 104 | 100 |
| Transportation | 107 | 106 | 100 |
| Utilities | 108 | 105 | 100 |
Source: Cost of living index, normalized to US average = 100
Prineville, OR Weather
The average high in Prineville is 62.1° and the average low is 33.5°.
There are 27.0 days of precipitation each year.
Expect an average of 10.6 inches of precipitation each year with 9.4 inches of snow.
| Stat | Prineville |
|---|---|
| Average Annual High | 62.1 |
| Average Annual Low | 33.5 |
| Annual Precipitation Days | 27.0 |
| Average Annual Precipitation | 10.6 |
| Average Annual Snowfall | 9.4 |
Average High
Days of Rain
Source: NOAA climate normals (30-year)
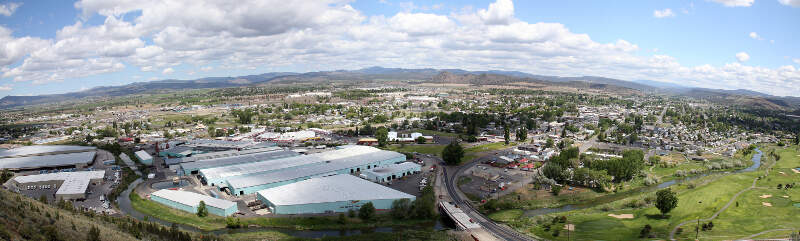
Prineville, OR Photos

2 Reviews & Comments About Prineville

I live in prineville we have 3 facebook data centers and 3 apple data centers just built along with a massive solar farm being built
As someone from Prineville, let me say it absolutely deserves #2 worst place in Oregon, if not #1. The smart people leave the first chance they get and never look back, and most of the people who stay are the dregs of society who don't have many o
Rankings & Articles For Prineville


Locations Around Prineville
Map Of Prineville, OR
Best Places Around Prineville
Bend, OR
Population 103,390
Redmond, OR
Population 36,092
Deschutes River Woods, OR
Population 5,797
Madras, OR
Population 7,676
Prineville Demographics And Statistics
Population over time in Prineville
The current population in Prineville is 11,470. The population has increased 21.4% from 2010.
| Year | Population | % Change |
|---|---|---|
| 2024 | 11,470 | 2.5% |
| 2023 | 11,187 | 2.5% |
| 2022 | 10,915 | 2.9% |
| 2021 | 10,611 | 1.7% |
| 2020 | 10,429 | 3.9% |
| 2019 | 10,035 | 2.9% |
| 2018 | 9,748 | 2.4% |
| 2017 | 9,515 | 1.0% |
| 2016 | 9,419 | 1.7% |
| 2015 | 9,266 | 0.9% |
| 2014 | 9,184 | -0.6% |
| 2013 | 9,241 | -0.6% |
| 2012 | 9,294 | -1.2% |
| 2011 | 9,408 | -0.4% |
| 2010 | 9,450 | - |
Race / Ethnicity in Prineville
See the full breakdown
Prineville is:
80.4% White with 9,224 White residents.
1.2% African American with 138 African American residents.
1.6% American Indian with 189 American Indian residents.
0.3% Asian with 39 Asian residents.
0.0% Hawaiian with 0 Hawaiian residents.
0.2% Other with 26 Other residents.
4.4% Two Or More with 504 Two Or More residents.
11.8% Hispanic with 1,350 Hispanic residents.
| Race | Prineville | OR | USA |
|---|---|---|---|
| White | 80.4% | 71.4% | 57.4% |
| African American | 1.2% | 1.8% | 11.9% |
| American Indian | 1.6% | 0.6% | 0.5% |
| Asian | 0.3% | 4.4% | 5.9% |
| Hawaiian | 0.0% | 0.4% | 0.2% |
| Other | 0.2% | 0.6% | 0.6% |
| Two Or More | 4.4% | 6.1% | 4.3% |
| Hispanic | 11.8% | 14.7% | 19.3% |
Gender in Prineville
See the full breakdown
Prineville is 52.8% female with 6,060 female residents.
Prineville is 47.2% male with 5,410 male residents.
| Gender | Prineville | OR | USA |
|---|---|---|---|
| Female | 52.8% | 50.1% | 50.5% |
| Male | 47.2% | 49.9% | 49.5% |
Highest level of educational attainment in Prineville for adults over 25
See the full breakdown
5.0% of adults in Prineville completed < 9th grade.
10.0% of adults in Prineville completed 9-12th grade.
36.0% of adults in Prineville completed high school / ged.
23.0% of adults in Prineville completed some college.
10.0% of adults in Prineville completed associate's degree.
11.0% of adults in Prineville completed bachelor's degree.
4.0% of adults in Prineville completed master's degree.
1.0% of adults in Prineville completed professional degree.
0.0% of adults in Prineville completed doctorate degree.
| Education | Prineville | OR | USA |
|---|---|---|---|
| < 9th Grade | 5.0% | 3.0% | 4.0% |
| 9-12th Grade | 10.0% | 5.0% | 6.0% |
| High School / GED | 36.0% | 22.0% | 26.0% |
| Some College | 23.0% | 24.0% | 19.0% |
| Associate's Degree | 10.0% | 9.0% | 9.0% |
| Bachelor's Degree | 11.0% | 23.0% | 22.0% |
| Master's Degree | 4.0% | 10.0% | 10.0% |
| Professional Degree | 1.0% | 2.0% | 2.0% |
| Doctorate Degree | 0.0% | 2.0% | 2.0% |
Household Income For Prineville, Oregon
See the full breakdown
2.3% of households in Prineville earn Less than $10,000.
3.4% of households in Prineville earn $10,000 to $14,999.
9.6% of households in Prineville earn $15,000 to $24,999.
7.9% of households in Prineville earn $25,000 to $34,999.
9.7% of households in Prineville earn $35,000 to $49,999.
21.1% of households in Prineville earn $50,000 to $74,999.
19.4% of households in Prineville earn $75,000 to $99,999.
16.7% of households in Prineville earn $100,000 to $149,999.
5.9% of households in Prineville earn $150,000 to $199,999.
4.0% of households in Prineville earn $200,000 or more.
| Income | Prineville | OR | USA |
|---|---|---|---|
| Less than $10,000 | 2.3% | 4.5% | 5.0% |
| $10,000 to $14,999 | 3.4% | 3.2% | 3.4% |
| $15,000 to $24,999 | 9.6% | 6.1% | 6.3% |
| $25,000 to $34,999 | 7.9% | 6.2% | 6.6% |
| $35,000 to $49,999 | 9.7% | 10.0% | 10.1% |
| $50,000 to $74,999 | 21.1% | 15.4% | 15.5% |
| $75,000 to $99,999 | 19.4% | 13.2% | 12.6% |
| $100,000 to $149,999 | 16.7% | 18.5% | 17.5% |
| $150,000 to $199,999 | 5.9% | 10.1% | 9.6% |
| $200,000 or more | 4.0% | 12.7% | 13.4% |
Source: U.S. Census ACS 5-year estimates (2024)


