Wilsonville SnackAbility
Overall SnackAbility
Cost of living in Wilsonville summary. We use data on the cost of living to determine how expensive it is to live in Wilsonville. Real estate prices drive most of the variance in cost of living around Oregon. Key points include:
The cost of living in Wilsonville is 134 with 100 being average.
The cost of living in Wilsonville is 1.3x higher than the national average.
The median home value in Wilsonville is $635,208.
The median income in Wilsonville is $96,236.
Wilsonville's Overall Cost Of Living
Higher Than The National Average
Cost Of Living In Wilsonville Comparison Table
| Living Expense | Wilsonville | Oregon | National Average |
|---|---|---|---|
| Overall | 134 | 109 | 100 |
| Services | 106 | 104 | 100 |
| Groceries | 104 | 106 | 100 |
| Health | 212 | 125 | 100 |
| Housing | 103 | 104 | 100 |
| Transportation | 105 | 106 | 100 |
| Utilities | 102 | 105 | 100 |
Source: Cost of living index, normalized to US average = 100
Wilsonville, OR Weather
The average high in Wilsonville is 63.1° and the average low is 43.9°.
There are 99.0 days of precipitation each year.
Expect an average of 41.7 inches of precipitation each year with 1.4 inches of snow.
| Stat | Wilsonville |
|---|---|
| Average Annual High | 63.1 |
| Average Annual Low | 43.9 |
| Annual Precipitation Days | 99.0 |
| Average Annual Precipitation | 41.7 |
| Average Annual Snowfall | 1.4 |
Average High
Days of Rain
Source: NOAA climate normals (30-year)
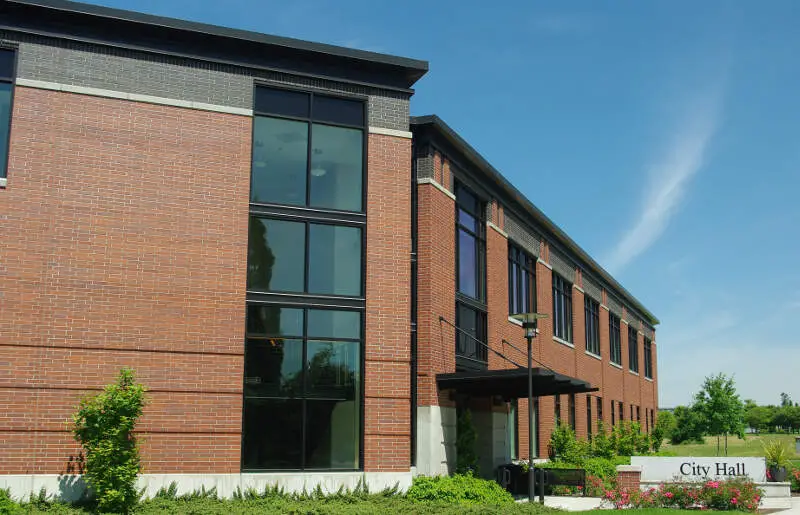
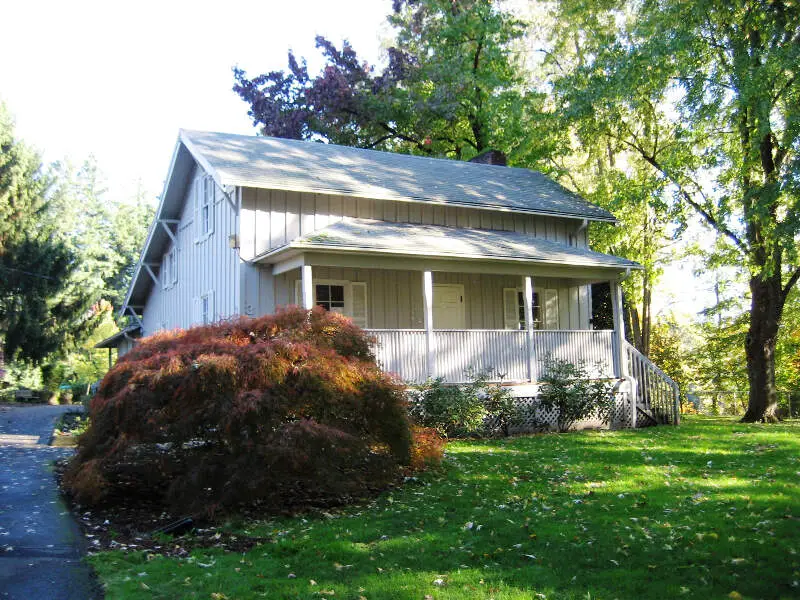
Wilsonville, OR Photos


Rankings & Articles For Wilsonville


Locations Around Wilsonville
Map Of Wilsonville, OR
Best Places Around Wilsonville
Oregon, WI
Population 11,547
Lake Oswego, OR
Population 40,381
West Linn, OR
Population 26,935
Sherwood, OR
Population 20,307
Bethany, OR
Population 33,106
Oatfield, OR
Population 13,294
Bull Mountain, OR
Population 9,865
Oak Hills, OR
Population 11,131
Tigard, OR
Population 56,011
Aloha, OR
Population 52,389
Wilsonville Demographics And Statistics
Population over time in Wilsonville
The current population in Wilsonville is 26,974. The population has increased 42.7% from 2010.
| Year | Population | % Change |
|---|---|---|
| 2024 | 26,974 | 3.0% |
| 2023 | 26,183 | 0.7% |
| 2022 | 25,992 | 0.4% |
| 2021 | 25,887 | 6.0% |
| 2020 | 24,413 | 1.4% |
| 2019 | 24,073 | 2.8% |
| 2018 | 23,418 | 2.8% |
| 2017 | 22,789 | 4.5% |
| 2016 | 21,814 | 4.7% |
| 2015 | 20,837 | 2.5% |
| 2014 | 20,335 | 3.6% |
| 2013 | 19,636 | 1.9% |
| 2012 | 19,262 | 2.2% |
| 2011 | 18,845 | -0.3% |
| 2010 | 18,900 | - |
Race / Ethnicity in Wilsonville
See the full breakdown
Wilsonville is:
71.4% White with 19,255 White residents.
1.3% African American with 355 African American residents.
0.3% American Indian with 79 American Indian residents.
4.1% Asian with 1,103 Asian residents.
0.9% Hawaiian with 253 Hawaiian residents.
0.7% Other with 192 Other residents.
5.8% Two Or More with 1,573 Two Or More residents.
15.4% Hispanic with 4,164 Hispanic residents.
| Race | Wilsonville | OR | USA |
|---|---|---|---|
| White | 71.4% | 71.4% | 57.4% |
| African American | 1.3% | 1.8% | 11.9% |
| American Indian | 0.3% | 0.6% | 0.5% |
| Asian | 4.1% | 4.4% | 5.9% |
| Hawaiian | 0.9% | 0.4% | 0.2% |
| Other | 0.7% | 0.6% | 0.6% |
| Two Or More | 5.8% | 6.1% | 4.3% |
| Hispanic | 15.4% | 14.7% | 19.3% |
Gender in Wilsonville
See the full breakdown
Wilsonville is 51.2% female with 13,808 female residents.
Wilsonville is 48.8% male with 13,165 male residents.
| Gender | Wilsonville | OR | USA |
|---|---|---|---|
| Female | 51.2% | 50.1% | 50.5% |
| Male | 48.8% | 49.9% | 49.5% |
Highest level of educational attainment in Wilsonville for adults over 25
See the full breakdown
1.0% of adults in Wilsonville completed < 9th grade.
3.0% of adults in Wilsonville completed 9-12th grade.
22.0% of adults in Wilsonville completed high school / ged.
21.0% of adults in Wilsonville completed some college.
8.0% of adults in Wilsonville completed associate's degree.
27.0% of adults in Wilsonville completed bachelor's degree.
13.0% of adults in Wilsonville completed master's degree.
3.0% of adults in Wilsonville completed professional degree.
2.0% of adults in Wilsonville completed doctorate degree.
| Education | Wilsonville | OR | USA |
|---|---|---|---|
| < 9th Grade | 1.0% | 3.0% | 4.0% |
| 9-12th Grade | 3.0% | 5.0% | 6.0% |
| High School / GED | 22.0% | 22.0% | 26.0% |
| Some College | 21.0% | 24.0% | 19.0% |
| Associate's Degree | 8.0% | 9.0% | 9.0% |
| Bachelor's Degree | 27.0% | 23.0% | 22.0% |
| Master's Degree | 13.0% | 10.0% | 10.0% |
| Professional Degree | 3.0% | 2.0% | 2.0% |
| Doctorate Degree | 2.0% | 2.0% | 2.0% |
Household Income For Wilsonville, Oregon
See the full breakdown
3.5% of households in Wilsonville earn Less than $10,000.
1.6% of households in Wilsonville earn $10,000 to $14,999.
3.9% of households in Wilsonville earn $15,000 to $24,999.
3.8% of households in Wilsonville earn $25,000 to $34,999.
8.7% of households in Wilsonville earn $35,000 to $49,999.
16.4% of households in Wilsonville earn $50,000 to $74,999.
13.7% of households in Wilsonville earn $75,000 to $99,999.
22.1% of households in Wilsonville earn $100,000 to $149,999.
10.5% of households in Wilsonville earn $150,000 to $199,999.
15.9% of households in Wilsonville earn $200,000 or more.
| Income | Wilsonville | OR | USA |
|---|---|---|---|
| Less than $10,000 | 3.5% | 4.5% | 5.0% |
| $10,000 to $14,999 | 1.6% | 3.2% | 3.4% |
| $15,000 to $24,999 | 3.9% | 6.1% | 6.3% |
| $25,000 to $34,999 | 3.8% | 6.2% | 6.6% |
| $35,000 to $49,999 | 8.7% | 10.0% | 10.1% |
| $50,000 to $74,999 | 16.4% | 15.4% | 15.5% |
| $75,000 to $99,999 | 13.7% | 13.2% | 12.6% |
| $100,000 to $149,999 | 22.1% | 18.5% | 17.5% |
| $150,000 to $199,999 | 10.5% | 10.1% | 9.6% |
| $200,000 or more | 15.9% | 12.7% | 13.4% |
Source: U.S. Census ACS 5-year estimates (2024)


