Compare Charleston to…
Charleston SnackAbility
Overall SnackAbility
Crime in Charleston summary. We use data from the FBI to determine the crime rates in Charleston. Key points include:
There were 3,733 total crimes in Charleston in the last reporting year.
The overall crime rate per 100,000 people in Charleston is 2,379.3 / 100k people.
The violent crime rate per 100,000 people in Charleston is 357.6 / 100k people.
The property crime rate per 100,000 people in Charleston is 2,021.7 / 100k people.
Overall, crime in Charleston is 12.27% above the national average.
Total Crimes
Above National Average
Crime In Charleston Comparison Table
| Statistic | Count Raw |
Charleston / 100k People |
South Carolina / 100k People |
National / 100k People |
|---|---|---|---|---|
| Total Crimes Per 100K | 3,733 | 2,379.3 | 2,402.5 | 2,119.2 |
| Violent Crime | 561 | 357.6 | 436.7 | 359.0 |
| Murder | 7 | 4.5 | 7.5 | 5.0 |
| Robbery | 67 | 42.7 | 35.1 | 61.0 |
| Aggravated Assault | 443 | 282.3 | 357.1 | 256.0 |
| Property Crime | 3,172 | 2,021.7 | 1,965.8 | 1,760.0 |
| Burglary | 219 | 139.6 | 282.4 | 229.0 |
| Larceny | 2,599 | 1,656.5 | 1,468.2 | 1,272.0 |
| Car Theft | 354 | 225.6 | 215.1 | 259.0 |
Source: FBI Uniform Crime Reporting (2024)
Cost of living in Charleston summary. We use data on the cost of living to determine how expensive it is to live in Charleston. Real estate prices drive most of the variance in cost of living around South Carolina. Key points include:
The cost of living in Charleston is 121 with 100 being average.
The cost of living in Charleston is 1.2x higher than the national average.
The median home value in Charleston is $589,607.
The median income in Charleston is $92,414.
Charleston's Overall Cost Of Living
Higher Than The National Average
Cost Of Living In Charleston Comparison Table
| Living Expense | Charleston | South Carolina | National Average |
|---|---|---|---|
| Overall | 121 | 92 | 100 |
| Services | 98 | 97 | 100 |
| Groceries | 101 | 96 | 100 |
| Health | 175 | 82 | 100 |
| Housing | 94 | 101 | 100 |
| Transportation | 101 | 101 | 100 |
| Utilities | 104 | 97 | 100 |
Source: Cost of living index, normalized to US average = 100
Charleston, SC Weather
The average high in Charleston is 74.8° and the average low is 56.5°.
There are 72.4 days of precipitation each year.
Expect an average of 47.4 inches of precipitation each year with 0.3 inches of snow.
| Stat | Charleston |
|---|---|
| Average Annual High | 74.8 |
| Average Annual Low | 56.5 |
| Annual Precipitation Days | 72.4 |
| Average Annual Precipitation | 47.4 |
| Average Annual Snowfall | 0.3 |
Average High
Days of Rain
Source: NOAA climate normals (30-year)
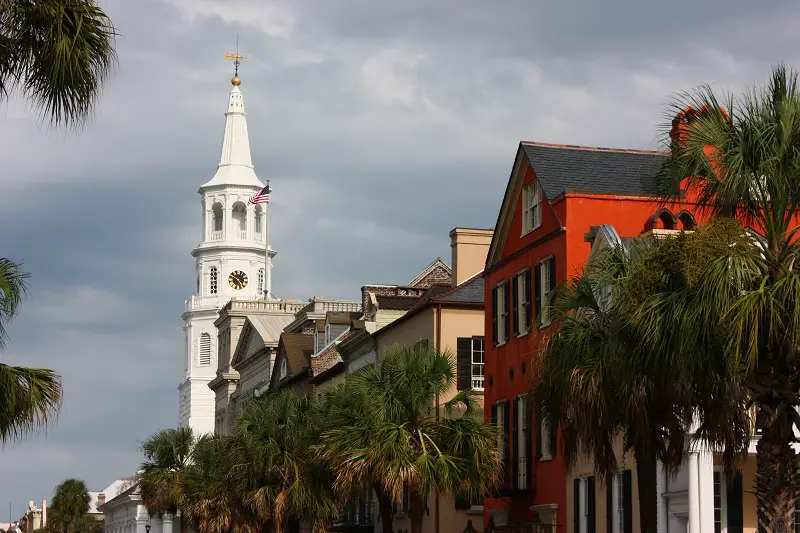
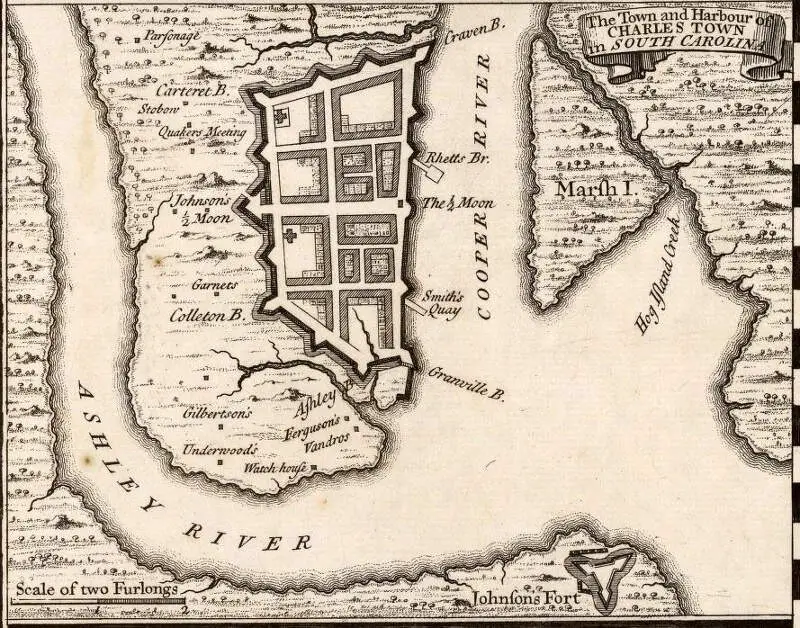
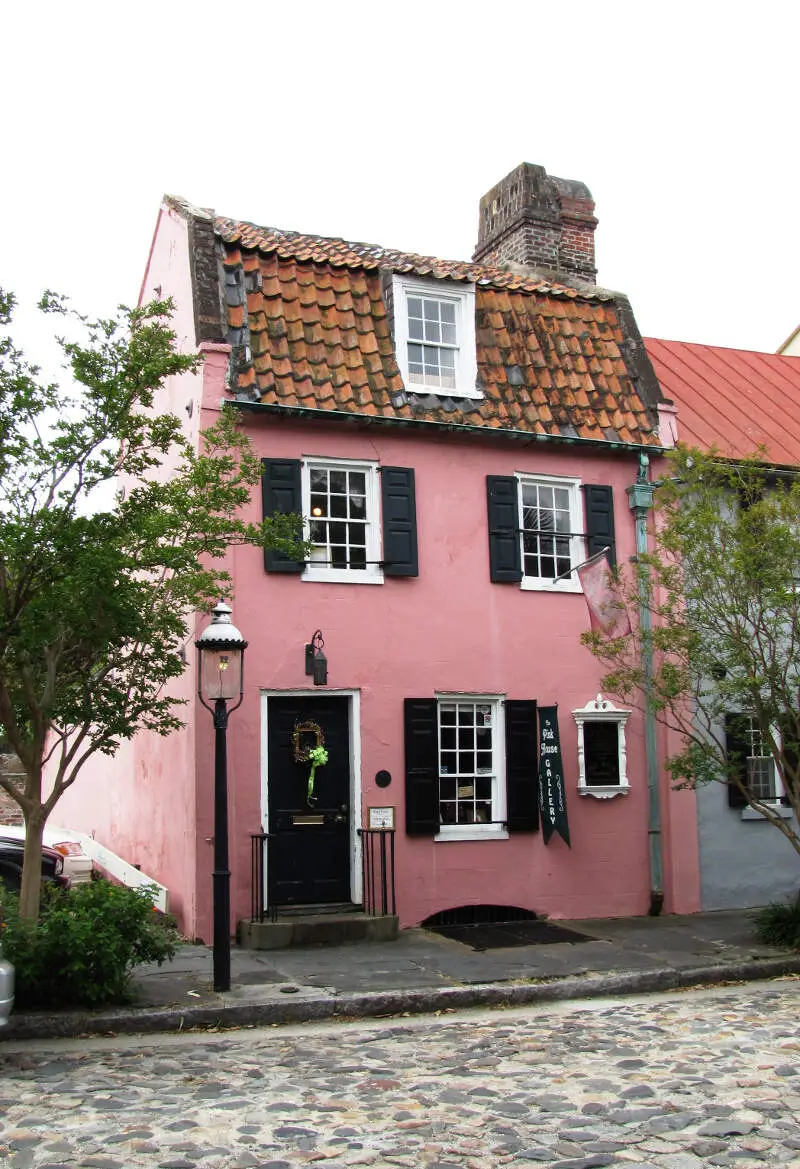
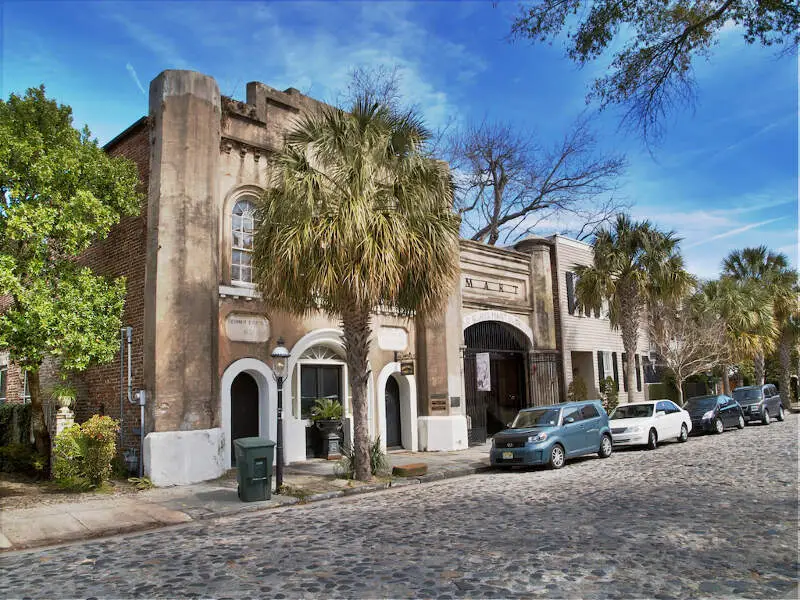
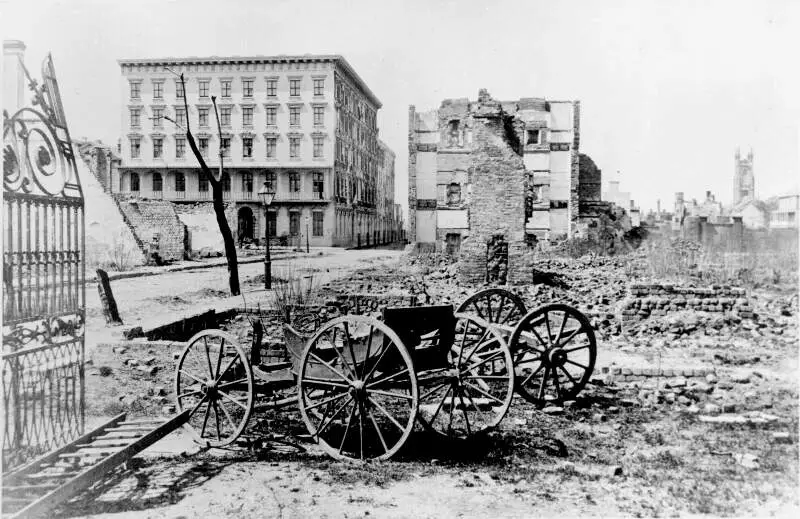
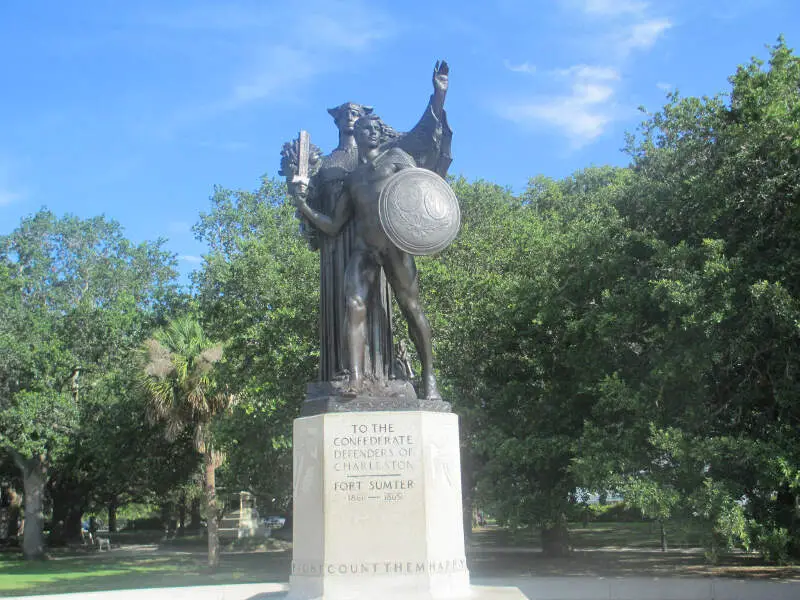
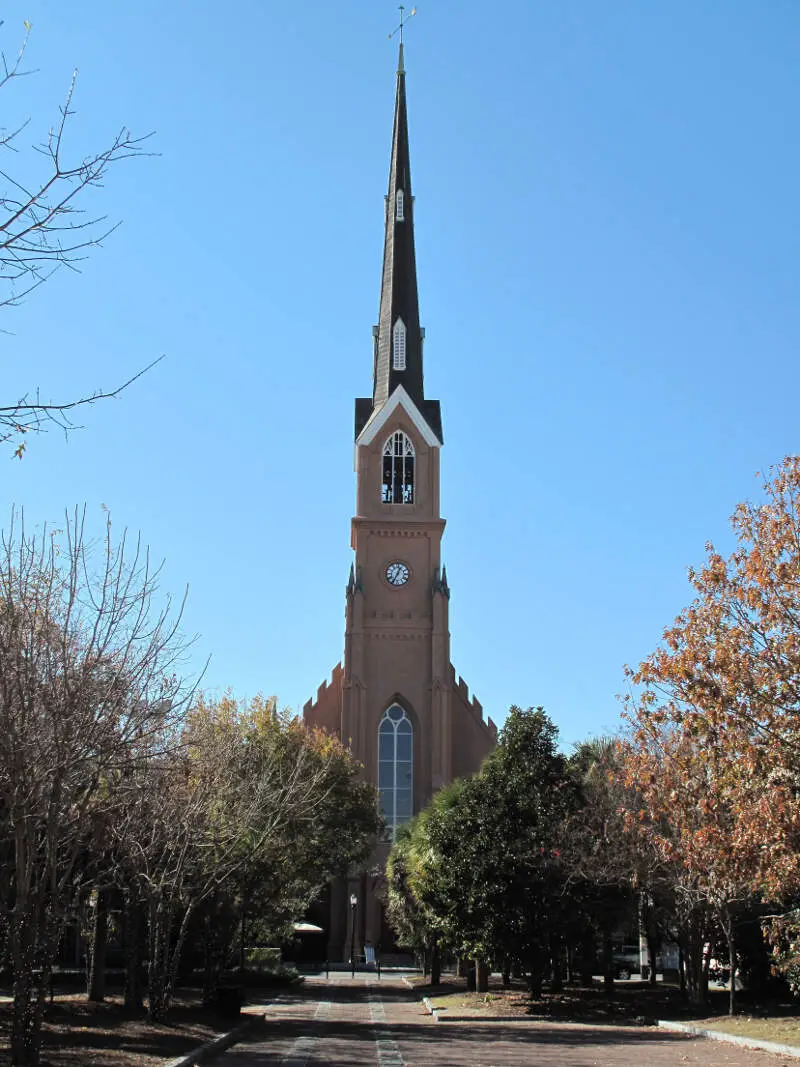
Charleston, SC Photos


3 Reviews & Comments About Charleston

I was born in Spartanburg, raised in Rock Hill and my wife is from Charleston...Rock Hill will always be my home but Charleston is by far the best city in the entire state.
I noticed very little crime while I was there, and the education is superb!! From colleges to elementary schools, the education in first rate with lots of real world experience. I Love this place!
What stands out to me is the classic Southern Charm of the place. Everything is peaceful and quiet. And the beauty stands out. The entire city is just beautiful!! The coast is also super nice along with the history of the area.
people are not there and very polite. Very clean city with beautiful beaches. i go there at least twice a year.
the beahes are beautiful. The air is very clean and the city is clean. the atmosphere is amazing there. a lot of happy hour and great food to eat
Rankings & Articles For Charleston


Locations Around Charleston
Map Of Charleston, SC
Best Places Around Charleston
Mount Pleasant, SC
Population 93,993
Summerville, SC
Population 51,654
Sangaree, SC
Population 8,681
Hanahan, SC
Population 21,452
Ladson, SC
Population 16,140
Goose Creek, SC
Population 48,078
North Charleston, SC
Population 119,913
Charleston Demographics And Statistics
Population over time in Charleston
The current population in Charleston is 154,338. The population has increased 32.7% from 2010.
| Year | Population | % Change |
|---|---|---|
| 2024 | 154,338 | 1.5% |
| 2023 | 152,014 | 1.4% |
| 2022 | 149,960 | 1.4% |
| 2021 | 147,928 | 7.9% |
| 2020 | 137,041 | 1.3% |
| 2019 | 135,257 | 1.1% |
| 2018 | 133,762 | 1.9% |
| 2017 | 131,204 | 1.0% |
| 2016 | 129,888 | 1.7% |
| 2015 | 127,694 | 1.8% |
| 2014 | 125,458 | 1.8% |
| 2013 | 123,267 | 2.0% |
| 2012 | 120,903 | 2.1% |
| 2011 | 118,401 | 1.8% |
| 2010 | 116,347 | - |
Race / Ethnicity in Charleston
See the full breakdown
Charleston is:
71.7% White with 110,737 White residents.
15.8% African American with 24,319 African American residents.
0.1% American Indian with 133 American Indian residents.
1.9% Asian with 2,916 Asian residents.
0.1% Hawaiian with 131 Hawaiian residents.
0.4% Other with 633 Other residents.
4.0% Two Or More with 6,118 Two Or More residents.
6.1% Hispanic with 9,351 Hispanic residents.
| Race | Charleston | SC | USA |
|---|---|---|---|
| White | 71.7% | 61.9% | 57.4% |
| African American | 15.8% | 24.6% | 11.9% |
| American Indian | 0.1% | 0.2% | 0.5% |
| Asian | 1.9% | 1.7% | 5.9% |
| Hawaiian | 0.1% | 0.0% | 0.2% |
| Other | 0.4% | 0.5% | 0.6% |
| Two Or More | 4.0% | 3.7% | 4.3% |
| Hispanic | 6.1% | 7.4% | 19.3% |
Gender in Charleston
See the full breakdown
Charleston is 52.3% female with 80,658 female residents.
Charleston is 47.7% male with 73,680 male residents.
| Gender | Charleston | SC | USA |
|---|---|---|---|
| Female | 52.3% | 51.3% | 50.5% |
| Male | 47.7% | 48.7% | 49.5% |
Highest level of educational attainment in Charleston for adults over 25
See the full breakdown
2.0% of adults in Charleston completed < 9th grade.
3.0% of adults in Charleston completed 9-12th grade.
15.0% of adults in Charleston completed high school / ged.
16.0% of adults in Charleston completed some college.
7.0% of adults in Charleston completed associate's degree.
35.0% of adults in Charleston completed bachelor's degree.
14.0% of adults in Charleston completed master's degree.
5.0% of adults in Charleston completed professional degree.
3.0% of adults in Charleston completed doctorate degree.
| Education | Charleston | SC | USA |
|---|---|---|---|
| < 9th Grade | 2.0% | 3.0% | 4.0% |
| 9-12th Grade | 3.0% | 7.0% | 6.0% |
| High School / GED | 15.0% | 28.0% | 26.0% |
| Some College | 16.0% | 20.0% | 19.0% |
| Associate's Degree | 7.0% | 10.0% | 9.0% |
| Bachelor's Degree | 35.0% | 20.0% | 22.0% |
| Master's Degree | 14.0% | 9.0% | 10.0% |
| Professional Degree | 5.0% | 2.0% | 2.0% |
| Doctorate Degree | 3.0% | 1.0% | 2.0% |
Household Income For Charleston, South Carolina
See the full breakdown
5.0% of households in Charleston earn Less than $10,000.
2.9% of households in Charleston earn $10,000 to $14,999.
6.2% of households in Charleston earn $15,000 to $24,999.
4.3% of households in Charleston earn $25,000 to $34,999.
8.6% of households in Charleston earn $35,000 to $49,999.
14.1% of households in Charleston earn $50,000 to $74,999.
12.3% of households in Charleston earn $75,000 to $99,999.
18.3% of households in Charleston earn $100,000 to $149,999.
10.8% of households in Charleston earn $150,000 to $199,999.
17.5% of households in Charleston earn $200,000 or more.
| Income | Charleston | SC | USA |
|---|---|---|---|
| Less than $10,000 | 5.0% | 5.9% | 5.0% |
| $10,000 to $14,999 | 2.9% | 3.8% | 3.4% |
| $15,000 to $24,999 | 6.2% | 7.3% | 6.3% |
| $25,000 to $34,999 | 4.3% | 7.7% | 6.6% |
| $35,000 to $49,999 | 8.6% | 11.9% | 10.1% |
| $50,000 to $74,999 | 14.1% | 17.0% | 15.5% |
| $75,000 to $99,999 | 12.3% | 13.1% | 12.6% |
| $100,000 to $149,999 | 18.3% | 16.4% | 17.5% |
| $150,000 to $199,999 | 10.8% | 8.0% | 9.6% |
| $200,000 or more | 17.5% | 8.9% | 13.4% |
Source: U.S. Census ACS 5-year estimates (2024)


