Columbia SnackAbility
Overall SnackAbility
Crime in Columbia summary. We use data from the FBI to determine the crime rates in Columbia. Key points include:
There were 5,786 total crimes in Columbia in the last reporting year.
The overall crime rate per 100,000 people in Columbia is 4,002.5 / 100k people.
The violent crime rate per 100,000 people in Columbia is 769.9 / 100k people.
The property crime rate per 100,000 people in Columbia is 3,232.6 / 100k people.
Overall, crime in Columbia is 88.87% above the national average.
Total Crimes
Above National Average
Crime In Columbia Comparison Table
| Statistic | Count Raw |
Columbia / 100k People |
South Carolina / 100k People |
National / 100k People |
|---|---|---|---|---|
| Total Crimes Per 100K | 5,786 | 4,002.5 | 2,402.5 | 2,119.2 |
| Violent Crime | 1,113 | 769.9 | 436.7 | 359.0 |
| Murder | 14 | 9.7 | 7.5 | 5.0 |
| Robbery | 157 | 108.6 | 35.1 | 61.0 |
| Aggravated Assault | 853 | 590.1 | 357.1 | 256.0 |
| Property Crime | 4,673 | 3,232.6 | 1,965.8 | 1,760.0 |
| Burglary | 718 | 496.7 | 282.4 | 229.0 |
| Larceny | 3,407 | 2,356.8 | 1,468.2 | 1,272.0 |
| Car Theft | 548 | 379.1 | 215.1 | 259.0 |
Source: FBI Uniform Crime Reporting (2024)
Cost of living in Columbia summary. We use data on the cost of living to determine how expensive it is to live in Columbia. Real estate prices drive most of the variance in cost of living around South Carolina. Key points include:
The cost of living in Columbia is 100 with 100 being average.
The cost of living in Columbia is 1.0x lower than the national average.
The median home value in Columbia is $229,067.
The median income in Columbia is $55,529.
Columbia's Overall Cost Of Living
Lower Than The National Average
Cost Of Living In Columbia Comparison Table
| Living Expense | Columbia | South Carolina | National Average |
|---|---|---|---|
| Overall | 100 | 92 | 100 |
| Services | 100 | 97 | 100 |
| Groceries | 102 | 96 | 100 |
| Health | 103 | 82 | 100 |
| Housing | 100 | 101 | 100 |
| Transportation | 105 | 101 | 100 |
| Utilities | 95 | 97 | 100 |
Source: Cost of living index, normalized to US average = 100
Columbia, SC Weather
The average high in Columbia is 75.0° and the average low is 51.7°.
There are 73.5 days of precipitation each year.
Expect an average of 44.6 inches of precipitation each year with 0.6 inches of snow.
| Stat | Columbia |
|---|---|
| Average Annual High | 75.0 |
| Average Annual Low | 51.7 |
| Annual Precipitation Days | 73.5 |
| Average Annual Precipitation | 44.6 |
| Average Annual Snowfall | 0.6 |
Average High
Days of Rain
Source: NOAA climate normals (30-year)
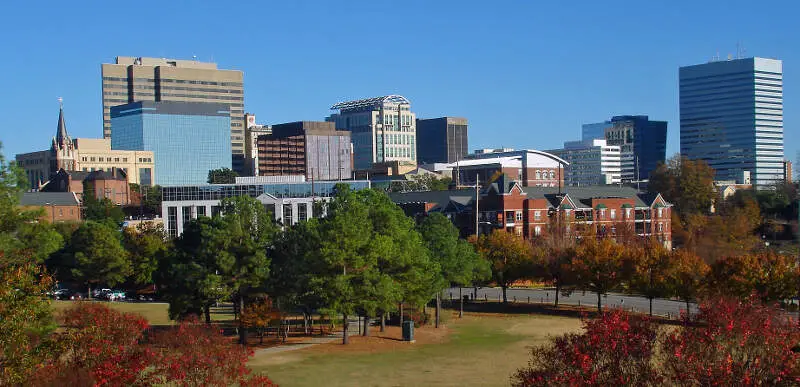
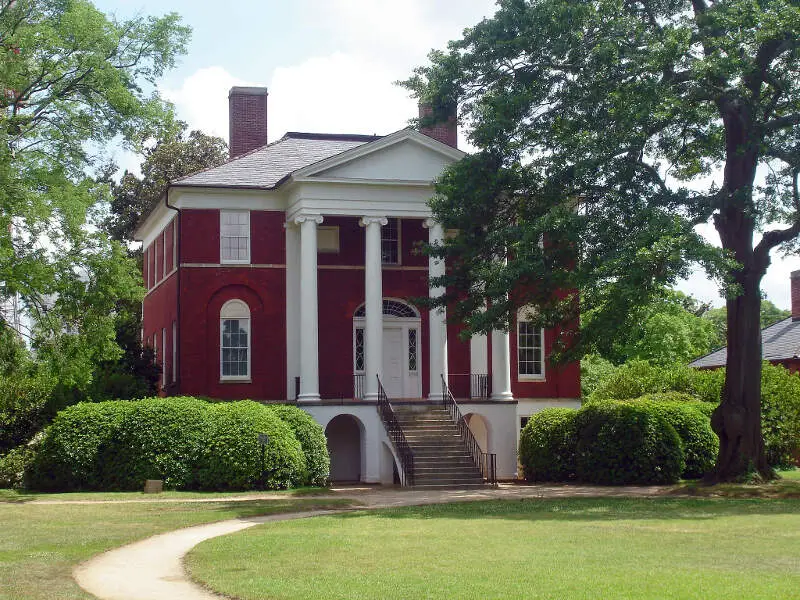
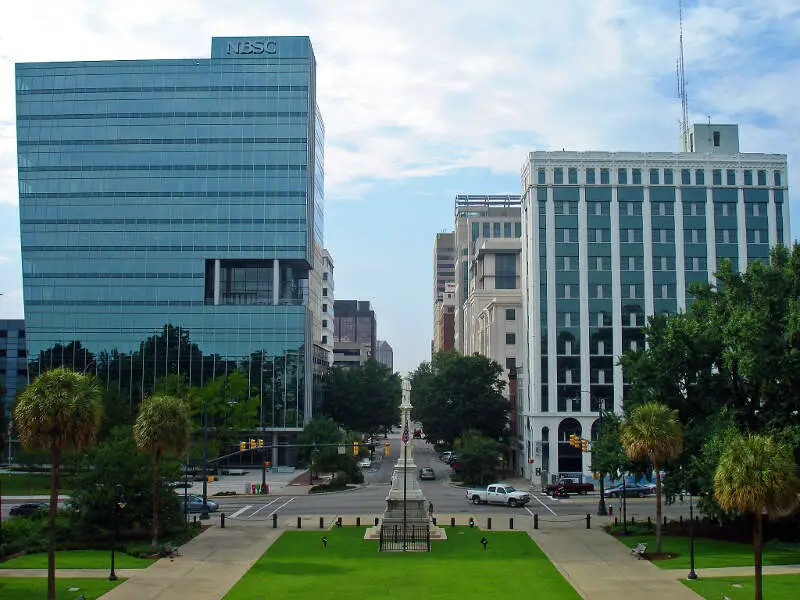
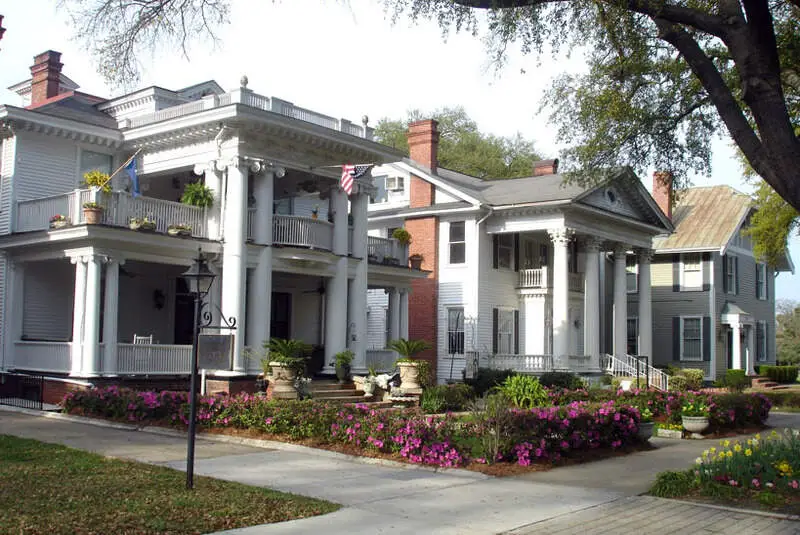
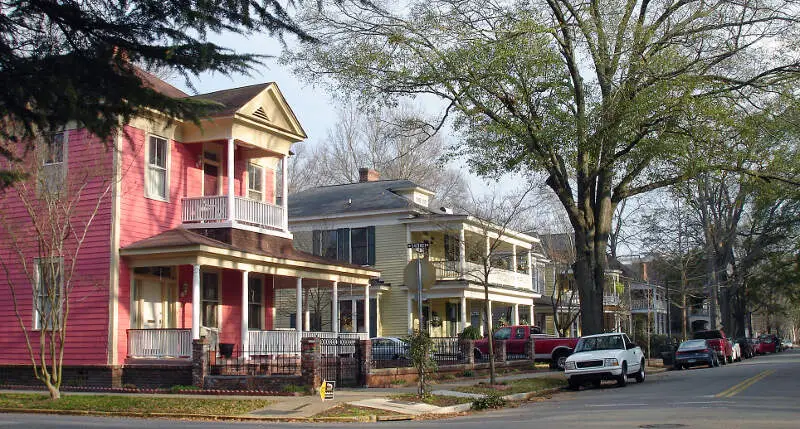
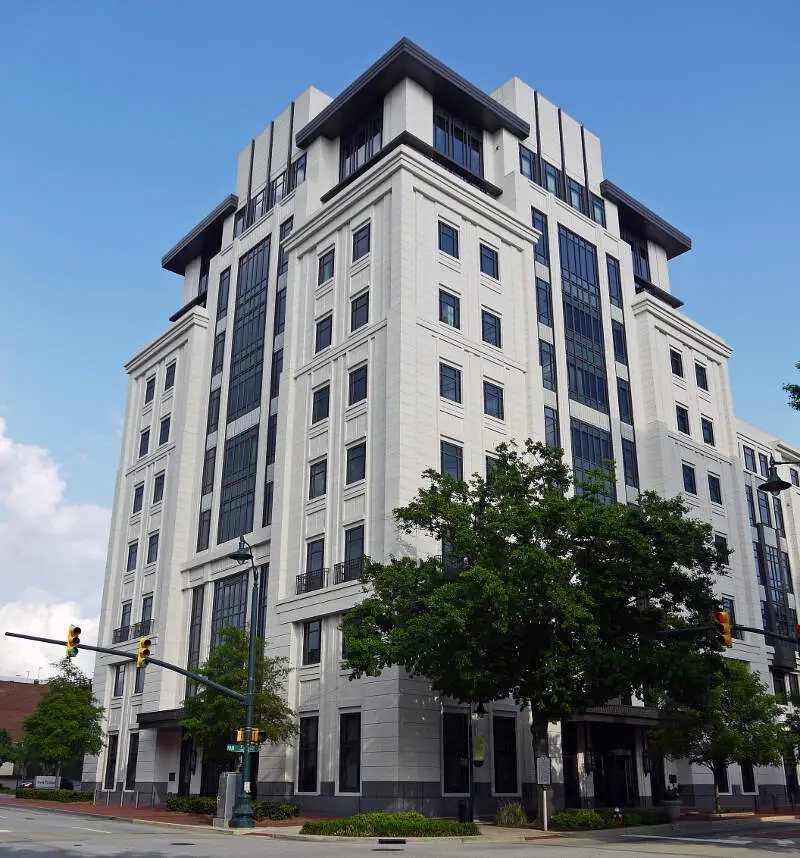
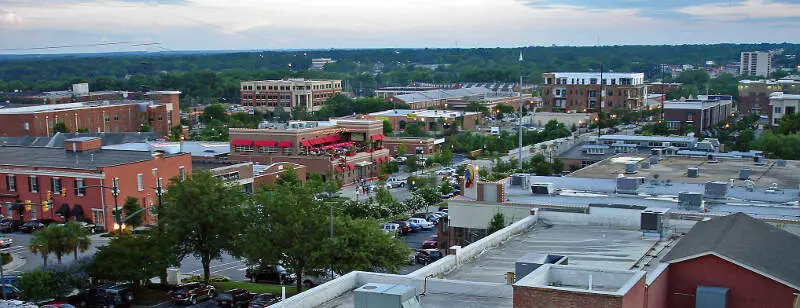
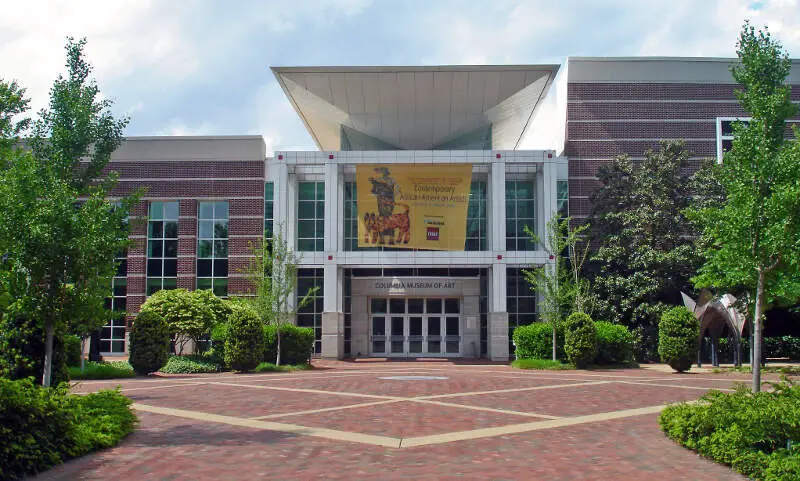
Columbia, SC Photos

2 Reviews & Comments About Columbia

It's not much to do in the area, most stores are being and/or have been relocated, Not much of a place i'd consider sociable.
There are some mines and things For sight seeing and collecting. The city is somewhat busy but the people are easy to get along with sometimes. The stores and products in them are pretty rare depending on what store you're visiting, and it's a lot of jobs there.
Columbia is an affordable city to live, but as it is the capital of the state, it does lack in tourist aspects. Columbia has a growing art and and music life, but it is a bit disconnected between different areas of the downtown region. Crime happens in all areas of the city.
Riverbanks Zoo is one of the best zoos in the country, so it is our tourism claim to fame. I am also quite proud of our library system.
Rankings & Articles For Columbia


Locations Around Columbia
Map Of Columbia, SC
Best Places Around Columbia
Lexington, SC
Population 24,585
Oak Grove, SC
Population 12,256
Seven Oaks, SC
Population 15,921
Irmo, SC
Population 11,813
Forest Acres, SC
Population 10,530
West Columbia, SC
Population 17,963
Lugoff, SC
Population 9,786
Woodfield, SC
Population 9,465
Cayce, SC
Population 13,741
Dentsville, SC
Population 15,209
Columbia Demographics And Statistics
Population over time in Columbia
The current population in Columbia is 139,643. The population has increased 9.4% from 2010.
| Year | Population | % Change |
|---|---|---|
| 2024 | 139,643 | 1.2% |
| 2023 | 138,019 | 0.9% |
| 2022 | 136,754 | -0.4% |
| 2021 | 137,276 | 2.4% |
| 2020 | 134,057 | 0.6% |
| 2019 | 133,273 | -0.1% |
| 2018 | 133,352 | 0.8% |
| 2017 | 132,236 | -0.2% |
| 2016 | 132,537 | 0.4% |
| 2015 | 131,958 | 0.5% |
| 2014 | 131,331 | 0.2% |
| 2013 | 131,004 | 1.0% |
| 2012 | 129,757 | 0.8% |
| 2011 | 128,777 | 0.9% |
| 2010 | 127,605 | - |
Race / Ethnicity in Columbia
See the full breakdown
Columbia is:
45.7% White with 63,825 White residents.
40.1% African American with 56,006 African American residents.
0.1% American Indian with 174 American Indian residents.
3.2% Asian with 4,436 Asian residents.
0.2% Hawaiian with 326 Hawaiian residents.
0.6% Other with 847 Other residents.
3.9% Two Or More with 5,378 Two Or More residents.
6.2% Hispanic with 8,651 Hispanic residents.
| Race | Columbia | SC | USA |
|---|---|---|---|
| White | 45.7% | 61.9% | 57.4% |
| African American | 40.1% | 24.6% | 11.9% |
| American Indian | 0.1% | 0.2% | 0.5% |
| Asian | 3.2% | 1.7% | 5.9% |
| Hawaiian | 0.2% | 0.0% | 0.2% |
| Other | 0.6% | 0.5% | 0.6% |
| Two Or More | 3.9% | 3.7% | 4.3% |
| Hispanic | 6.2% | 7.4% | 19.3% |
Gender in Columbia
See the full breakdown
Columbia is 50.8% female with 70,916 female residents.
Columbia is 49.2% male with 68,727 male residents.
| Gender | Columbia | SC | USA |
|---|---|---|---|
| Female | 50.8% | 51.3% | 50.5% |
| Male | 49.2% | 48.7% | 49.5% |
Highest level of educational attainment in Columbia for adults over 25
See the full breakdown
4.0% of adults in Columbia completed < 9th grade.
6.0% of adults in Columbia completed 9-12th grade.
20.0% of adults in Columbia completed high school / ged.
18.0% of adults in Columbia completed some college.
7.0% of adults in Columbia completed associate's degree.
24.0% of adults in Columbia completed bachelor's degree.
13.0% of adults in Columbia completed master's degree.
5.0% of adults in Columbia completed professional degree.
3.0% of adults in Columbia completed doctorate degree.
| Education | Columbia | SC | USA |
|---|---|---|---|
| < 9th Grade | 4.0% | 3.0% | 4.0% |
| 9-12th Grade | 6.0% | 7.0% | 6.0% |
| High School / GED | 20.0% | 28.0% | 26.0% |
| Some College | 18.0% | 20.0% | 19.0% |
| Associate's Degree | 7.0% | 10.0% | 9.0% |
| Bachelor's Degree | 24.0% | 20.0% | 22.0% |
| Master's Degree | 13.0% | 9.0% | 10.0% |
| Professional Degree | 5.0% | 2.0% | 2.0% |
| Doctorate Degree | 3.0% | 1.0% | 2.0% |
Household Income For Columbia, South Carolina
See the full breakdown
11.1% of households in Columbia earn Less than $10,000.
5.4% of households in Columbia earn $10,000 to $14,999.
8.4% of households in Columbia earn $15,000 to $24,999.
8.4% of households in Columbia earn $25,000 to $34,999.
12.3% of households in Columbia earn $35,000 to $49,999.
15.8% of households in Columbia earn $50,000 to $74,999.
10.3% of households in Columbia earn $75,000 to $99,999.
11.0% of households in Columbia earn $100,000 to $149,999.
6.7% of households in Columbia earn $150,000 to $199,999.
10.6% of households in Columbia earn $200,000 or more.
| Income | Columbia | SC | USA |
|---|---|---|---|
| Less than $10,000 | 11.1% | 5.9% | 5.0% |
| $10,000 to $14,999 | 5.4% | 3.8% | 3.4% |
| $15,000 to $24,999 | 8.4% | 7.3% | 6.3% |
| $25,000 to $34,999 | 8.4% | 7.7% | 6.6% |
| $35,000 to $49,999 | 12.3% | 11.9% | 10.1% |
| $50,000 to $74,999 | 15.8% | 17.0% | 15.5% |
| $75,000 to $99,999 | 10.3% | 13.1% | 12.6% |
| $100,000 to $149,999 | 11.0% | 16.4% | 17.5% |
| $150,000 to $199,999 | 6.7% | 8.0% | 9.6% |
| $200,000 or more | 10.6% | 8.9% | 13.4% |
Source: U.S. Census ACS 5-year estimates (2024)


