Darlington SnackAbility
Overall SnackAbility
Crime in Darlington summary. We use data from the FBI to determine the crime rates in Darlington. Key points include:
There were 422 total crimes in Darlington in the last reporting year.
The overall crime rate per 100,000 people in Darlington is 7,018.1 / 100k people.
The violent crime rate per 100,000 people in Darlington is 1,130.9 / 100k people.
The property crime rate per 100,000 people in Darlington is 5,887.2 / 100k people.
Overall, crime in Darlington is 231.16% above the national average.
Total Crimes
Above National Average
Crime In Darlington Comparison Table
| Statistic | Count Raw |
Darlington / 100k People |
South Carolina / 100k People |
National / 100k People |
|---|---|---|---|---|
| Total Crimes Per 100K | 422 | 7,018.1 | 2,402.5 | 2,119.2 |
| Violent Crime | 68 | 1,130.9 | 436.7 | 359.0 |
| Murder | 1 | 16.6 | 7.5 | 5.0 |
| Robbery | 5 | 83.2 | 35.1 | 61.0 |
| Aggravated Assault | 61 | 1,014.5 | 357.1 | 256.0 |
| Property Crime | 354 | 5,887.2 | 1,965.8 | 1,760.0 |
| Burglary | 37 | 615.3 | 282.4 | 229.0 |
| Larceny | 264 | 4,390.5 | 1,468.2 | 1,272.0 |
| Car Theft | 53 | 881.4 | 215.1 | 259.0 |
Source: FBI Uniform Crime Reporting (2024)
Cost of living in Darlington summary. We use data on the cost of living to determine how expensive it is to live in Darlington. Real estate prices drive most of the variance in cost of living around South Carolina. Key points include:
The cost of living in Darlington is 90 with 100 being average.
The cost of living in Darlington is 0.9x lower than the national average.
The median home value in Darlington is $153,322.
The median income in Darlington is $33,952.
Darlington's Overall Cost Of Living
Lower Than The National Average
Cost Of Living In Darlington Comparison Table
| Living Expense | Darlington | South Carolina | National Average |
|---|---|---|---|
| Overall | 90 | 92 | 100 |
| Services | 100 | 97 | 100 |
| Groceries | 101 | 96 | 100 |
| Health | 67 | 82 | 100 |
| Housing | 100 | 101 | 100 |
| Transportation | 103 | 101 | 100 |
| Utilities | 98 | 97 | 100 |
Source: Cost of living index, normalized to US average = 100
Darlington, SC Weather
The average high in Darlington is 74.4° and the average low is 51.0°.
There are 74.4 days of precipitation each year.
Expect an average of 46.3 inches of precipitation each year with 0.6 inches of snow.
| Stat | Darlington |
|---|---|
| Average Annual High | 74.4 |
| Average Annual Low | 51.0 |
| Annual Precipitation Days | 74.4 |
| Average Annual Precipitation | 46.3 |
| Average Annual Snowfall | 0.6 |
Average High
Days of Rain
Source: NOAA climate normals (30-year)
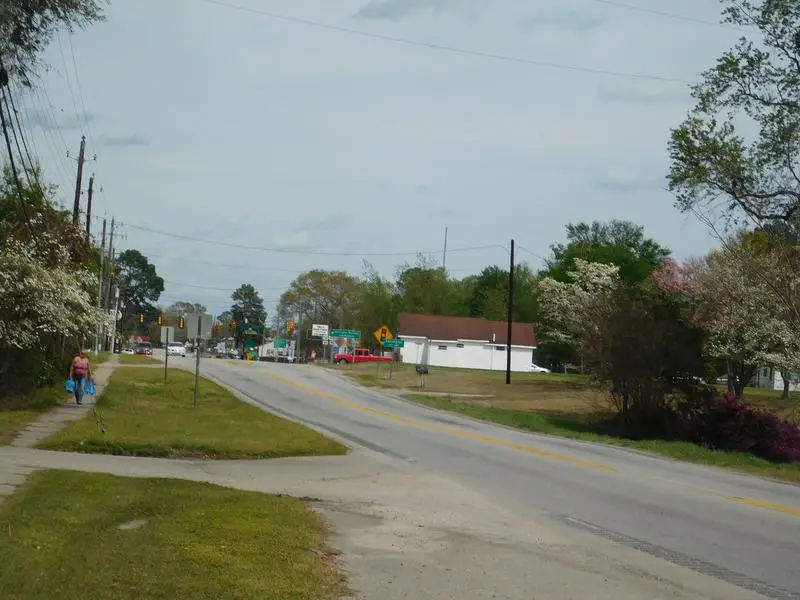
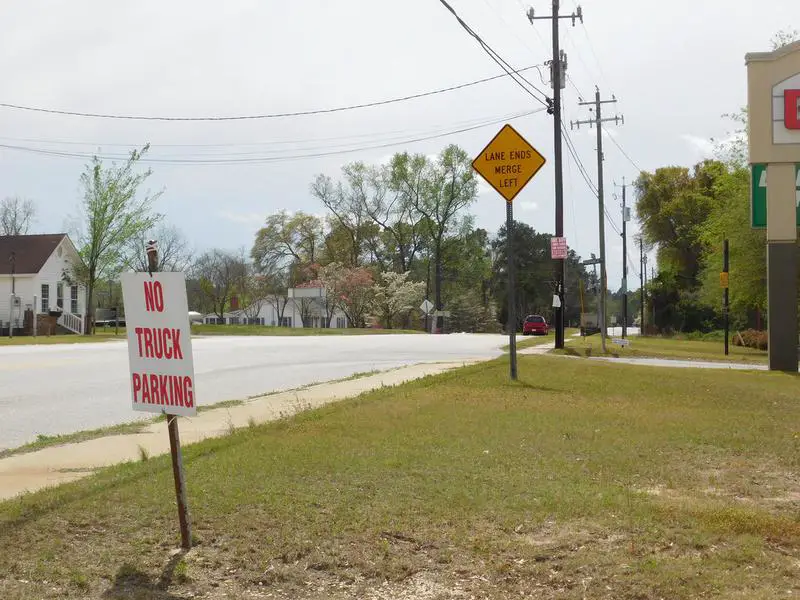
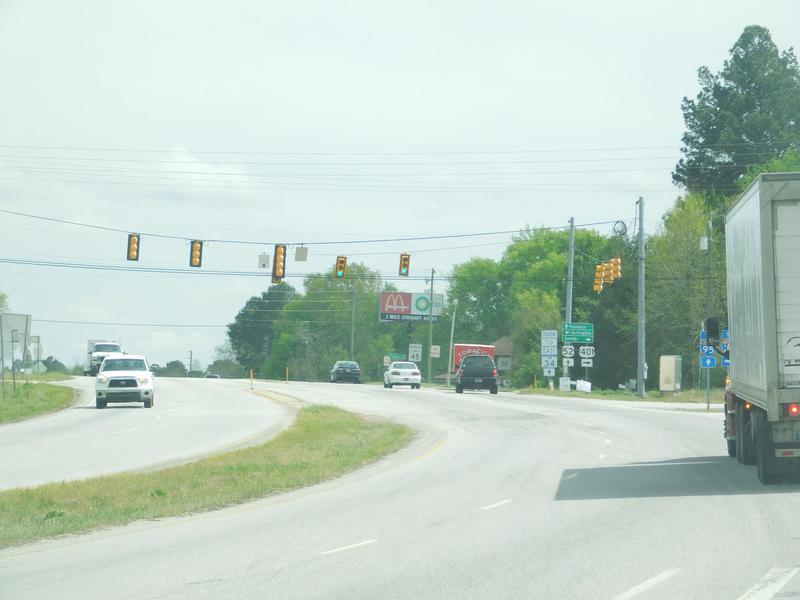
Darlington, SC Photos
1 Reviews & Comments About Darlington

I live in Darlington... we ranked #1 and I just laugh. If you fooktards are getting worked up over this stuff, you need to get a life.
Rankings & Articles For Darlington


Locations Around Darlington
Map Of Darlington, SC
Best Places Around Darlington
Lugoff, SC
Population 9,786
Camden, SC
Population 8,267
Florence, SC
Population 40,408
Laurinburg, NC
Population 15,087
Sumter, SC
Population 43,053
Hartsville, SC
Population 7,419
Bennettsville, SC
Population 7,751
Wadesboro, NC
Population 4,972
Hamlet, NC
Population 5,961
Marion, SC
Population 6,206
Darlington Demographics And Statistics
Population over time in Darlington
The current population in Darlington is 6,120. The population has decreased 4.0% from 2010.
| Year | Population | % Change |
|---|---|---|
| 2024 | 6,120 | -0.1% |
| 2023 | 6,128 | -0.7% |
| 2022 | 6,172 | 0.3% |
| 2021 | 6,153 | 2.5% |
| 2020 | 6,000 | -0.7% |
| 2019 | 6,043 | 0.1% |
| 2018 | 6,034 | -0.7% |
| 2017 | 6,075 | -1.8% |
| 2016 | 6,185 | -0.4% |
| 2015 | 6,212 | -0.3% |
| 2014 | 6,232 | -0.7% |
| 2013 | 6,275 | -0.3% |
| 2012 | 6,291 | -0.6% |
| 2011 | 6,329 | -0.7% |
| 2010 | 6,374 | - |
Race / Ethnicity in Darlington
See the full breakdown
Darlington is:
32.5% White with 1,991 White residents.
61.3% African American with 3,750 African American residents.
0.0% American Indian with 0 American Indian residents.
0.0% Asian with 0 Asian residents.
0.0% Hawaiian with 0 Hawaiian residents.
0.0% Other with 0 Other residents.
2.7% Two Or More with 167 Two Or More residents.
3.5% Hispanic with 212 Hispanic residents.
| Race | Darlington | SC | USA |
|---|---|---|---|
| White | 32.5% | 61.9% | 57.4% |
| African American | 61.3% | 24.6% | 11.9% |
| American Indian | 0.0% | 0.2% | 0.5% |
| Asian | 0.0% | 1.7% | 5.9% |
| Hawaiian | 0.0% | 0.0% | 0.2% |
| Other | 0.0% | 0.5% | 0.6% |
| Two Or More | 2.7% | 3.7% | 4.3% |
| Hispanic | 3.5% | 7.4% | 19.3% |
Gender in Darlington
See the full breakdown
Darlington is 59.3% female with 3,632 female residents.
Darlington is 40.7% male with 2,488 male residents.
| Gender | Darlington | SC | USA |
|---|---|---|---|
| Female | 59.3% | 51.3% | 50.5% |
| Male | 40.7% | 48.7% | 49.5% |
Highest level of educational attainment in Darlington for adults over 25
See the full breakdown
7.0% of adults in Darlington completed < 9th grade.
11.0% of adults in Darlington completed 9-12th grade.
31.0% of adults in Darlington completed high school / ged.
24.0% of adults in Darlington completed some college.
8.0% of adults in Darlington completed associate's degree.
10.0% of adults in Darlington completed bachelor's degree.
5.0% of adults in Darlington completed master's degree.
2.0% of adults in Darlington completed professional degree.
2.0% of adults in Darlington completed doctorate degree.
| Education | Darlington | SC | USA |
|---|---|---|---|
| < 9th Grade | 7.0% | 3.0% | 4.0% |
| 9-12th Grade | 11.0% | 7.0% | 6.0% |
| High School / GED | 31.0% | 28.0% | 26.0% |
| Some College | 24.0% | 20.0% | 19.0% |
| Associate's Degree | 8.0% | 10.0% | 9.0% |
| Bachelor's Degree | 10.0% | 20.0% | 22.0% |
| Master's Degree | 5.0% | 9.0% | 10.0% |
| Professional Degree | 2.0% | 2.0% | 2.0% |
| Doctorate Degree | 2.0% | 1.0% | 2.0% |
Household Income For Darlington, South Carolina
See the full breakdown
14.4% of households in Darlington earn Less than $10,000.
11.6% of households in Darlington earn $10,000 to $14,999.
13.1% of households in Darlington earn $15,000 to $24,999.
11.4% of households in Darlington earn $25,000 to $34,999.
14.5% of households in Darlington earn $35,000 to $49,999.
11.1% of households in Darlington earn $50,000 to $74,999.
8.0% of households in Darlington earn $75,000 to $99,999.
7.2% of households in Darlington earn $100,000 to $149,999.
4.9% of households in Darlington earn $150,000 to $199,999.
3.9% of households in Darlington earn $200,000 or more.
| Income | Darlington | SC | USA |
|---|---|---|---|
| Less than $10,000 | 14.4% | 5.9% | 5.0% |
| $10,000 to $14,999 | 11.6% | 3.8% | 3.4% |
| $15,000 to $24,999 | 13.1% | 7.3% | 6.3% |
| $25,000 to $34,999 | 11.4% | 7.7% | 6.6% |
| $35,000 to $49,999 | 14.5% | 11.9% | 10.1% |
| $50,000 to $74,999 | 11.1% | 17.0% | 15.5% |
| $75,000 to $99,999 | 8.0% | 13.1% | 12.6% |
| $100,000 to $149,999 | 7.2% | 16.4% | 17.5% |
| $150,000 to $199,999 | 4.9% | 8.0% | 9.6% |
| $200,000 or more | 3.9% | 8.9% | 13.4% |
Source: U.S. Census ACS 5-year estimates (2024)


