Lancaster SnackAbility
Overall SnackAbility
Cost of living in Lancaster summary. We use data on the cost of living to determine how expensive it is to live in Lancaster. Real estate prices drive most of the variance in cost of living around South Carolina. Key points include:
The cost of living in Lancaster is 95 with 100 being average.
The cost of living in Lancaster is 0.9x lower than the national average.
The median home value in Lancaster is $291,062.
The median income in Lancaster is $46,311.
Lancaster's Overall Cost Of Living
Lower Than The National Average
Cost Of Living In Lancaster Comparison Table
| Living Expense | Lancaster | South Carolina | National Average |
|---|---|---|---|
| Overall | 95 | 92 | 100 |
| Services | 98 | 97 | 100 |
| Groceries | 98 | 96 | 100 |
| Health | 82 | 82 | 100 |
| Housing | 101 | 101 | 100 |
| Transportation | 101 | 101 | 100 |
| Utilities | 101 | 97 | 100 |
Source: Cost of living index, normalized to US average = 100
Lancaster, SC Weather
The average high in Lancaster is 72.6° and the average low is 49.9°.
There are 71.2 days of precipitation each year.
Expect an average of 44.2 inches of precipitation each year with 1.7 inches of snow.
| Stat | Lancaster |
|---|---|
| Average Annual High | 72.6 |
| Average Annual Low | 49.9 |
| Annual Precipitation Days | 71.2 |
| Average Annual Precipitation | 44.2 |
| Average Annual Snowfall | 1.7 |
Average High
Days of Rain
Source: NOAA climate normals (30-year)
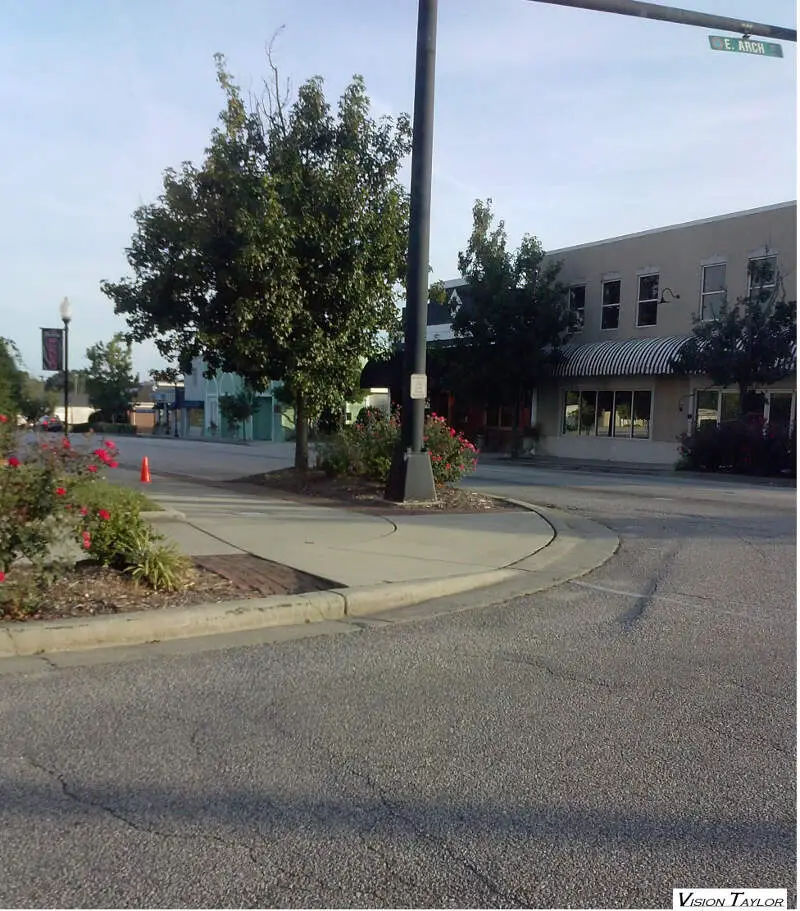
Lancaster, SC Photos
4 Reviews & Comments About Lancaster

Guy can't even pronounce the city's right. I was born and raised In Lancaster. It's a beautiful place. Good folks
I've lived in Lancaster most of my life and yep its trash
Bruh I live in Lancaster we have fun tho it's not bad
I lived in Lancaster for a few years, and they had some of the nicest people there. It was the most expensive town I had ever lived in, but it had a lot to offer when I lived there!
Rankings & Articles For Lancaster


Locations Around Lancaster
Map Of Lancaster, SC
Best Places Around Lancaster
Matthews, NC
Population 30,577
Harrisburg, NC
Population 19,633
Marvin, NC
Population 6,692
Stallings, NC
Population 16,886
Indian Trail, NC
Population 42,036
Wesley Chapel, NC
Population 9,090
Weddington, NC
Population 13,805
Huntersville, NC
Population 63,969
Charlotte, NC
Population 903,844
Concord, NC
Population 108,719
Lancaster Demographics And Statistics
Population over time in Lancaster
The current population in Lancaster is 8,921. The population has increased 7.7% from 2010.
| Year | Population | % Change |
|---|---|---|
| 2024 | 8,921 | 2.1% |
| 2023 | 8,738 | 1.7% |
| 2022 | 8,592 | 1.2% |
| 2021 | 8,489 | -7.6% |
| 2020 | 9,187 | 0.5% |
| 2019 | 9,143 | -0.1% |
| 2018 | 9,150 | 2.3% |
| 2017 | 8,948 | -0.3% |
| 2016 | 8,971 | 1.3% |
| 2015 | 8,853 | 0.6% |
| 2014 | 8,801 | 1.1% |
| 2013 | 8,703 | 1.9% |
| 2012 | 8,542 | 1.4% |
| 2011 | 8,424 | 1.7% |
| 2010 | 8,283 | - |
Race / Ethnicity in Lancaster
See the full breakdown
Lancaster is:
40.3% White with 3,592 White residents.
45.9% African American with 4,098 African American residents.
0.2% American Indian with 14 American Indian residents.
0.8% Asian with 68 Asian residents.
0.0% Hawaiian with 0 Hawaiian residents.
0.3% Other with 29 Other residents.
1.2% Two Or More with 106 Two Or More residents.
11.4% Hispanic with 1,014 Hispanic residents.
| Race | Lancaster | SC | USA |
|---|---|---|---|
| White | 40.3% | 61.9% | 57.4% |
| African American | 45.9% | 24.6% | 11.9% |
| American Indian | 0.2% | 0.2% | 0.5% |
| Asian | 0.8% | 1.7% | 5.9% |
| Hawaiian | 0.0% | 0.0% | 0.2% |
| Other | 0.3% | 0.5% | 0.6% |
| Two Or More | 1.2% | 3.7% | 4.3% |
| Hispanic | 11.4% | 7.4% | 19.3% |
Gender in Lancaster
See the full breakdown
Lancaster is 53.2% female with 4,749 female residents.
Lancaster is 46.8% male with 4,171 male residents.
| Gender | Lancaster | SC | USA |
|---|---|---|---|
| Female | 53.2% | 51.3% | 50.5% |
| Male | 46.8% | 48.7% | 49.5% |
Highest level of educational attainment in Lancaster for adults over 25
See the full breakdown
12.0% of adults in Lancaster completed < 9th grade.
8.0% of adults in Lancaster completed 9-12th grade.
28.0% of adults in Lancaster completed high school / ged.
21.0% of adults in Lancaster completed some college.
10.0% of adults in Lancaster completed associate's degree.
12.0% of adults in Lancaster completed bachelor's degree.
7.0% of adults in Lancaster completed master's degree.
2.0% of adults in Lancaster completed professional degree.
0.0% of adults in Lancaster completed doctorate degree.
| Education | Lancaster | SC | USA |
|---|---|---|---|
| < 9th Grade | 12.0% | 3.0% | 4.0% |
| 9-12th Grade | 8.0% | 7.0% | 6.0% |
| High School / GED | 28.0% | 28.0% | 26.0% |
| Some College | 21.0% | 20.0% | 19.0% |
| Associate's Degree | 10.0% | 10.0% | 9.0% |
| Bachelor's Degree | 12.0% | 20.0% | 22.0% |
| Master's Degree | 7.0% | 9.0% | 10.0% |
| Professional Degree | 2.0% | 2.0% | 2.0% |
| Doctorate Degree | 0.0% | 1.0% | 2.0% |
Household Income For Lancaster, South Carolina
See the full breakdown
10.3% of households in Lancaster earn Less than $10,000.
7.0% of households in Lancaster earn $10,000 to $14,999.
15.1% of households in Lancaster earn $15,000 to $24,999.
7.5% of households in Lancaster earn $25,000 to $34,999.
15.5% of households in Lancaster earn $35,000 to $49,999.
17.6% of households in Lancaster earn $50,000 to $74,999.
9.2% of households in Lancaster earn $75,000 to $99,999.
10.2% of households in Lancaster earn $100,000 to $149,999.
2.0% of households in Lancaster earn $150,000 to $199,999.
5.6% of households in Lancaster earn $200,000 or more.
| Income | Lancaster | SC | USA |
|---|---|---|---|
| Less than $10,000 | 10.3% | 5.9% | 5.0% |
| $10,000 to $14,999 | 7.0% | 3.8% | 3.4% |
| $15,000 to $24,999 | 15.1% | 7.3% | 6.3% |
| $25,000 to $34,999 | 7.5% | 7.7% | 6.6% |
| $35,000 to $49,999 | 15.5% | 11.9% | 10.1% |
| $50,000 to $74,999 | 17.6% | 17.0% | 15.5% |
| $75,000 to $99,999 | 9.2% | 13.1% | 12.6% |
| $100,000 to $149,999 | 10.2% | 16.4% | 17.5% |
| $150,000 to $199,999 | 2.0% | 8.0% | 9.6% |
| $200,000 or more | 5.6% | 8.9% | 13.4% |
Source: U.S. Census ACS 5-year estimates (2024)


