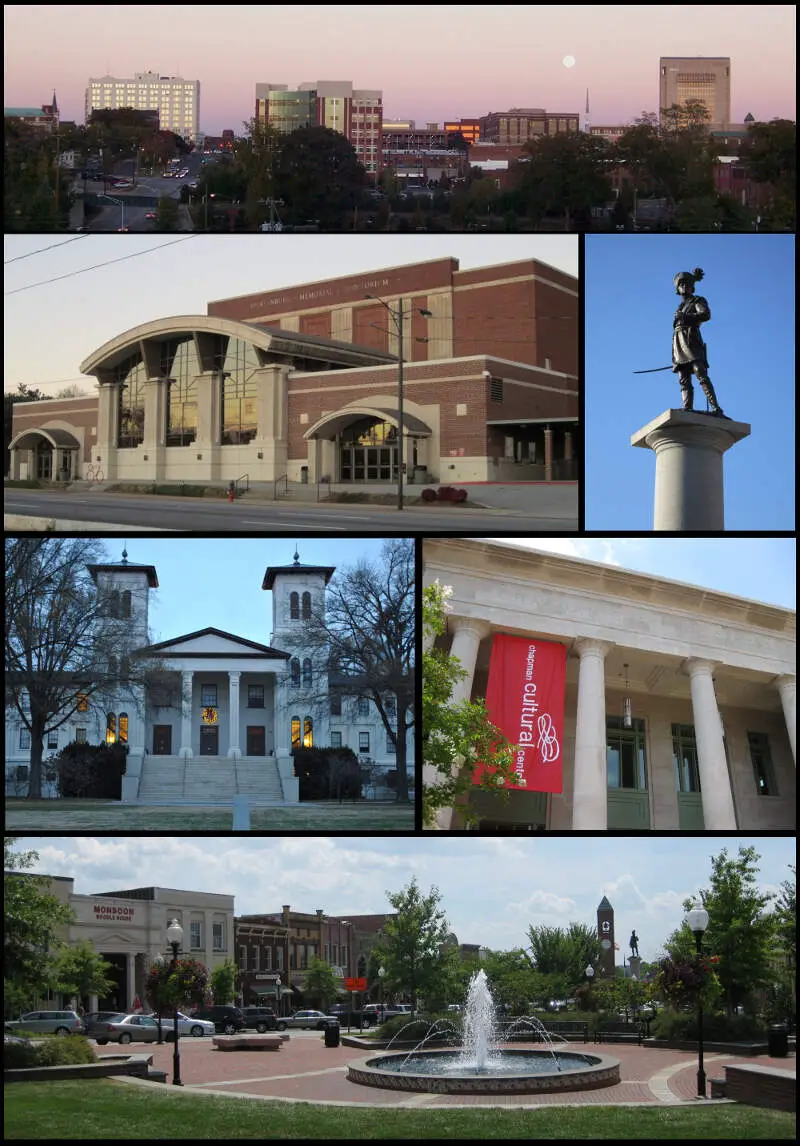
Spartanburg, SC
Demographics And Statistics
Living In Spartanburg, South Carolina Summary
Life in Spartanburg research summary. HomeSnacks has been using Saturday Night Science to research the quality of life in Spartanburg over the past nine years using Census, FBI, Zillow, and other primary data sources. Based on the most recently available data, we found the following about life in Spartanburg:
The population in Spartanburg is 38,578.
The median home value in Spartanburg is $227,894.
The median income in Spartanburg is $51,193.
The cost of living in Spartanburg is 92 which is 0.9x lower than the national average.
The median rent in Spartanburg is $1,043.
The unemployment rate in Spartanburg is 7.0%.
The poverty rate in Spartanburg is 24.1%.
The average high in Spartanburg is 72.0° and the average low is 48.9°.
Spartanburg SnackAbility
Overall SnackAbility
Spartanburg, SC Crime Report
Crime in Spartanburg summary. We use data from the FBI to determine the crime rates in Spartanburg. Key points include:
There were 2,629 total crimes in Spartanburg in the last reporting year.
The overall crime rate per 100,000 people in Spartanburg is 6,709.0 / 100k people.
The violent crime rate per 100,000 people in Spartanburg is 1,480.1 / 100k people.
The property crime rate per 100,000 people in Spartanburg is 5,228.9 / 100k people.
Overall, crime in Spartanburg is 216.58% above the national average.
Total Crimes
Above National Average
Crime In Spartanburg Comparison Table
| Statistic | Count Raw |
Spartanburg / 100k People |
South Carolina / 100k People |
National / 100k People |
|---|---|---|---|---|
| Total Crimes Per 100K | 2,629 | 6,709.0 | 2,402.5 | 2,119.2 |
| Violent Crime | 580 | 1,480.1 | 436.7 | 359.0 |
| Murder | 2 | 5.1 | 7.5 | 5.0 |
| Robbery | 64 | 163.3 | 35.1 | 61.0 |
| Aggravated Assault | 480 | 1,224.9 | 357.1 | 256.0 |
| Property Crime | 2,049 | 5,228.9 | 1,965.8 | 1,760.0 |
| Burglary | 370 | 944.2 | 282.4 | 229.0 |
| Larceny | 1,432 | 3,654.4 | 1,468.2 | 1,272.0 |
| Car Theft | 247 | 630.3 | 215.1 | 259.0 |
Spartanburg, SC Cost Of Living
Cost of living in Spartanburg summary. We use data on the cost of living to determine how expensive it is to live in Spartanburg. Real estate prices drive most of the variance in cost of living around South Carolina. Key points include:
The cost of living in Spartanburg is 92 with 100 being average.
The cost of living in Spartanburg is 0.9x lower than the national average.
The median home value in Spartanburg is $227,894.
The median income in Spartanburg is $51,193.
Spartanburg's Overall Cost Of Living
Lower Than The National Average
Cost Of Living In Spartanburg Comparison Table
| Living Expense | Spartanburg | South Carolina | National Average | |
|---|---|---|---|---|
| Overall | 92 | 93 | 100 | |
| Services | 97 | 102 | 100 | |
| Groceries | 97 | 97 | 100 | |
| Health | 98 | 92 | 100 | |
| Housing | 76 | 81 | 100 | |
| Transportation | 96 | 92 | 100 | |
| Utilities | 94 | 109 | 100 | |
Spartanburg, SC Weather
The average high in Spartanburg is 72.0° and the average low is 48.9°.
There are 73.3 days of precipitation each year.
Expect an average of 48.7 inches of precipitation each year with 1.7 inches of snow.
| Stat | Spartanburg |
|---|---|
| Average Annual High | 72.0 |
| Average Annual Low | 48.9 |
| Annual Precipitation Days | 73.3 |
| Average Annual Precipitation | 48.7 |
| Average Annual Snowfall | 1.7 |
Average High
Days of Rain
Spartanburg, SC Photos


2 Reviews & Comments About Spartanburg
/5

Ethan Bayne - None
I live in Spartanburg SC!! love it here in this beautiful town!!
shawn&alisha porter - None
I live in Spartanburg sc it's great here I love it
Rankings for Spartanburg in South Carolina


Locations Around Spartanburg
Map Of Spartanburg, SC
Best Places Around Spartanburg
Five Forks, SC
Population 19,093
Boiling Springs, SC
Population 12,609
Greer, SC
Population 39,191
Valley Falls, SC
Population 7,249
Gaffney, SC
Population 12,612
Spartanburg Demographics And Statistics
Population over time in Spartanburg
The current population in Spartanburg is 38,578. The population has increased 2.9% from 2010.
| Year | Population | % Change |
|---|---|---|
| 2023 | 38,578 | 0.7% |
| 2022 | 38,301 | 0.8% |
| 2021 | 37,990 | 1.4% |
| 2020 | 37,448 | 0.1% |
| 2019 | 37,424 | 0.1% |
| 2018 | 37,370 | -0.0% |
| 2017 | 37,384 | -0.5% |
| 2016 | 37,570 | 0.3% |
| 2015 | 37,465 | 0.7% |
| 2014 | 37,216 | -0.5% |
| 2013 | 37,386 | 0.1% |
| 2012 | 37,333 | -0.2% |
| 2011 | 37,409 | -0.2% |
| 2010 | 37,488 | - |
Race / Ethnicity in Spartanburg
Spartanburg is:
46.4% White with 17,918 White residents.
42.1% African American with 16,233 African American residents.
0.1% American Indian with 31 American Indian residents.
2.0% Asian with 766 Asian residents.
0.0% Hawaiian with 6 Hawaiian residents.
0.3% Other with 133 Other residents.
2.5% Two Or More with 961 Two Or More residents.
6.6% Hispanic with 2,530 Hispanic residents.
| Race | Spartanburg | SC | USA |
|---|---|---|---|
| White | 46.4% | 62.2% | 58.2% |
| African American | 42.1% | 25.1% | 12.0% |
| American Indian | 0.1% | 0.2% | 0.5% |
| Asian | 2.0% | 1.7% | 5.7% |
| Hawaiian | 0.0% | 0.1% | 0.2% |
| Other | 0.3% | 0.4% | 0.5% |
| Two Or More | 2.5% | 3.2% | 3.9% |
| Hispanic | 6.6% | 7.1% | 19.0% |
Gender in Spartanburg
Spartanburg is 54.4% female with 20,995 female residents.
Spartanburg is 45.6% male with 17,583 male residents.
| Gender | Spartanburg | SC | USA |
|---|---|---|---|
| Female | 54.4% | 51.3% | 50.5% |
| Male | 45.6% | 48.7% | 49.5% |
Highest level of educational attainment in Spartanburg for adults over 25
3.0% of adults in Spartanburg completed < 9th grade.
10.0% of adults in Spartanburg completed 9-12th grade.
29.0% of adults in Spartanburg completed high school / ged.
17.0% of adults in Spartanburg completed some college.
8.0% of adults in Spartanburg completed associate's degree.
20.0% of adults in Spartanburg completed bachelor's degree.
9.0% of adults in Spartanburg completed master's degree.
2.0% of adults in Spartanburg completed professional degree.
2.0% of adults in Spartanburg completed doctorate degree.
| Education | Spartanburg | SC | USA |
|---|---|---|---|
| < 9th Grade | 3.0% | 4.0% | 5.0% |
| 9-12th Grade | 10.0% | 7.0% | 6.0% |
| High School / GED | 29.0% | 28.0% | 26.0% |
| Some College | 17.0% | 20.0% | 19.0% |
| Associate's Degree | 8.0% | 10.0% | 9.0% |
| Bachelor's Degree | 20.0% | 19.0% | 21.0% |
| Master's Degree | 9.0% | 9.0% | 10.0% |
| Professional Degree | 2.0% | 2.0% | 2.0% |
| Doctorate Degree | 2.0% | 1.0% | 2.0% |
Household Income For Spartanburg, South Carolina
9.9% of households in Spartanburg earn Less than $10,000.
7.8% of households in Spartanburg earn $10,000 to $14,999.
8.6% of households in Spartanburg earn $15,000 to $24,999.
8.3% of households in Spartanburg earn $25,000 to $34,999.
14.5% of households in Spartanburg earn $35,000 to $49,999.
17.4% of households in Spartanburg earn $50,000 to $74,999.
9.4% of households in Spartanburg earn $75,000 to $99,999.
13.8% of households in Spartanburg earn $100,000 to $149,999.
4.9% of households in Spartanburg earn $150,000 to $199,999.
5.5% of households in Spartanburg earn $200,000 or more.
| Income | Spartanburg | SC | USA |
|---|---|---|---|
| Less than $10,000 | 9.9% | 5.9% | 4.9% |
| $10,000 to $14,999 | 7.8% | 4.0% | 3.6% |
| $15,000 to $24,999 | 8.6% | 7.8% | 6.6% |
| $25,000 to $34,999 | 8.3% | 8.0% | 6.8% |
| $35,000 to $49,999 | 14.5% | 12.3% | 10.4% |
| $50,000 to $74,999 | 17.4% | 17.2% | 15.7% |
| $75,000 to $99,999 | 9.4% | 12.9% | 12.7% |
| $100,000 to $149,999 | 13.8% | 16.1% | 17.4% |
| $150,000 to $199,999 | 4.9% | 7.5% | 9.3% |
| $200,000 or more | 5.5% | 8.3% | 12.6% |


