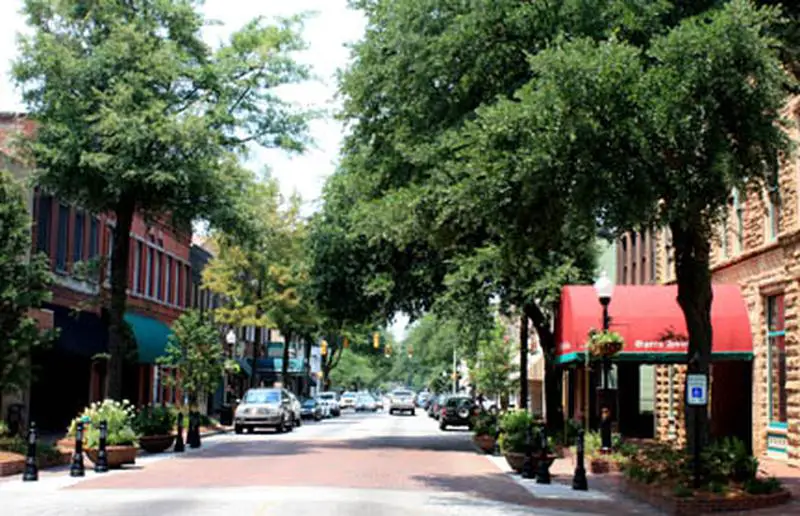
Sumter, SC
Demographics And Statistics
Living In Sumter, South Carolina Summary
Life in Sumter research summary. HomeSnacks has been using Saturday Night Science to research the quality of life in Sumter over the past nine years using Census, FBI, Zillow, and other primary data sources. Based on the most recently available data, we found the following about life in Sumter:
The population in Sumter is 43,065.
The median home value in Sumter is $209,899.
The median income in Sumter is $53,071.
The cost of living in Sumter is 94 which is 0.9x lower than the national average.
The median rent in Sumter is $1,055.
The unemployment rate in Sumter is 7.8%.
The poverty rate in Sumter is 15.8%.
The average high in Sumter is 75.1° and the average low is 51.6°.
Sumter SnackAbility
Overall SnackAbility
Sumter, SC Crime Report
Crime in Sumter summary. We use data from the FBI to determine the crime rates in Sumter. Key points include:
There were 2,044 total crimes in Sumter in the last reporting year.
The overall crime rate per 100,000 people in Sumter is 4,803.6 / 100k people.
The violent crime rate per 100,000 people in Sumter is 1,097.5 / 100k people.
The property crime rate per 100,000 people in Sumter is 3,706.1 / 100k people.
Overall, crime in Sumter is 126.67% above the national average.
Total Crimes
Above National Average
Crime In Sumter Comparison Table
| Statistic | Count Raw |
Sumter / 100k People |
South Carolina / 100k People |
National / 100k People |
|---|---|---|---|---|
| Total Crimes Per 100K | 2,044 | 4,803.6 | 2,402.5 | 2,119.2 |
| Violent Crime | 467 | 1,097.5 | 436.7 | 359.0 |
| Murder | 10 | 23.5 | 7.5 | 5.0 |
| Robbery | 28 | 65.8 | 35.1 | 61.0 |
| Aggravated Assault | 419 | 984.7 | 357.1 | 256.0 |
| Property Crime | 1,577 | 3,706.1 | 1,965.8 | 1,760.0 |
| Burglary | 145 | 340.8 | 282.4 | 229.0 |
| Larceny | 1,223 | 2,874.2 | 1,468.2 | 1,272.0 |
| Car Theft | 209 | 491.2 | 215.1 | 259.0 |
Sumter, SC Cost Of Living
Cost of living in Sumter summary. We use data on the cost of living to determine how expensive it is to live in Sumter. Real estate prices drive most of the variance in cost of living around South Carolina. Key points include:
The cost of living in Sumter is 94 with 100 being average.
The cost of living in Sumter is 0.9x lower than the national average.
The median home value in Sumter is $209,899.
The median income in Sumter is $53,071.
Sumter's Overall Cost Of Living
Lower Than The National Average
Cost Of Living In Sumter Comparison Table
| Living Expense | Sumter | South Carolina | National Average | |
|---|---|---|---|---|
| Overall | 94 | 93 | 100 | |
| Services | 96 | 102 | 100 | |
| Groceries | 98 | 97 | 100 | |
| Health | 85 | 92 | 100 | |
| Housing | 79 | 81 | 100 | |
| Transportation | 80 | 92 | 100 | |
| Utilities | 132 | 109 | 100 | |
Sumter, SC Weather
The average high in Sumter is 75.1° and the average low is 51.6°.
There are 74.9 days of precipitation each year.
Expect an average of 46.1 inches of precipitation each year with 0.6 inches of snow.
| Stat | Sumter |
|---|---|
| Average Annual High | 75.1 |
| Average Annual Low | 51.6 |
| Annual Precipitation Days | 74.9 |
| Average Annual Precipitation | 46.1 |
| Average Annual Snowfall | 0.6 |
Average High
Days of Rain
Sumter, SC Photos
1 Reviews & Comments About Sumter
/5

HomeSnacks User - 2018-08-28 00:05:08.475989
Sumter, SC is a wonderful community. There is a homey, southern charm about this city. Known for some great BBQ, Swan Lake-a beautiful park with a well know art show in May, and Shaw AFB. Built around a lowland swamp, you will find beauty in the many lakes and ponds, which are surrounded by Spanish moss covered trees.
Swan Lake is a very pretty place to visit. There is a fabulous art show in May. There are some "depressed" areas outside of town, but the city looks as if they are trying to revamp those older run down areas.
Rankings for Sumter in South Carolina


Locations Around Sumter
Map Of Sumter, SC
Best Places Around Sumter
Lexington, SC
Population 24,132
Oak Grove, SC
Population 12,031
Seven Oaks, SC
Population 15,990
Irmo, SC
Population 11,799
Red Bank, SC
Population 10,950
Forest Acres, SC
Population 10,491
West Columbia, SC
Population 17,723
Lugoff, SC
Population 9,475
Woodfield, SC
Population 9,901
Camden, SC
Population 8,025
Sumter Demographics And Statistics
Population over time in Sumter
The current population in Sumter is 43,065. The population has increased 6.8% from 2010.
| Year | Population | % Change |
|---|---|---|
| 2023 | 43,065 | 0.0% |
| 2022 | 43,046 | 0.3% |
| 2021 | 42,920 | 8.0% |
| 2020 | 39,758 | -0.1% |
| 2019 | 39,800 | -0.4% |
| 2018 | 39,964 | -0.8% |
| 2017 | 40,286 | -1.2% |
| 2016 | 40,760 | -0.2% |
| 2015 | 40,851 | 0.1% |
| 2014 | 40,819 | 0.0% |
| 2013 | 40,811 | 0.7% |
| 2012 | 40,533 | 0.4% |
| 2011 | 40,388 | 0.1% |
| 2010 | 40,340 | - |
Race / Ethnicity in Sumter
Sumter is:
38.6% White with 16,611 White residents.
47.4% African American with 20,430 African American residents.
0.1% American Indian with 46 American Indian residents.
2.8% Asian with 1,212 Asian residents.
0.0% Hawaiian with 0 Hawaiian residents.
0.7% Other with 295 Other residents.
3.6% Two Or More with 1,543 Two Or More residents.
6.8% Hispanic with 2,928 Hispanic residents.
| Race | Sumter | SC | USA |
|---|---|---|---|
| White | 38.6% | 62.2% | 58.2% |
| African American | 47.4% | 25.1% | 12.0% |
| American Indian | 0.1% | 0.2% | 0.5% |
| Asian | 2.8% | 1.7% | 5.7% |
| Hawaiian | 0.0% | 0.1% | 0.2% |
| Other | 0.7% | 0.4% | 0.5% |
| Two Or More | 3.6% | 3.2% | 3.9% |
| Hispanic | 6.8% | 7.1% | 19.0% |
Gender in Sumter
Sumter is 49.5% female with 21,308 female residents.
Sumter is 50.5% male with 21,756 male residents.
| Gender | Sumter | SC | USA |
|---|---|---|---|
| Female | 49.5% | 51.3% | 50.5% |
| Male | 50.5% | 48.7% | 49.5% |
Highest level of educational attainment in Sumter for adults over 25
1.0% of adults in Sumter completed < 9th grade.
9.0% of adults in Sumter completed 9-12th grade.
29.0% of adults in Sumter completed high school / ged.
21.0% of adults in Sumter completed some college.
10.0% of adults in Sumter completed associate's degree.
18.0% of adults in Sumter completed bachelor's degree.
10.0% of adults in Sumter completed master's degree.
1.0% of adults in Sumter completed professional degree.
1.0% of adults in Sumter completed doctorate degree.
| Education | Sumter | SC | USA |
|---|---|---|---|
| < 9th Grade | 1.0% | 4.0% | 5.0% |
| 9-12th Grade | 9.0% | 7.0% | 6.0% |
| High School / GED | 29.0% | 28.0% | 26.0% |
| Some College | 21.0% | 20.0% | 19.0% |
| Associate's Degree | 10.0% | 10.0% | 9.0% |
| Bachelor's Degree | 18.0% | 19.0% | 21.0% |
| Master's Degree | 10.0% | 9.0% | 10.0% |
| Professional Degree | 1.0% | 2.0% | 2.0% |
| Doctorate Degree | 1.0% | 1.0% | 2.0% |
Household Income For Sumter, South Carolina
8.3% of households in Sumter earn Less than $10,000.
5.8% of households in Sumter earn $10,000 to $14,999.
9.8% of households in Sumter earn $15,000 to $24,999.
9.5% of households in Sumter earn $25,000 to $34,999.
14.3% of households in Sumter earn $35,000 to $49,999.
17.0% of households in Sumter earn $50,000 to $74,999.
12.4% of households in Sumter earn $75,000 to $99,999.
12.1% of households in Sumter earn $100,000 to $149,999.
5.3% of households in Sumter earn $150,000 to $199,999.
5.4% of households in Sumter earn $200,000 or more.
| Income | Sumter | SC | USA |
|---|---|---|---|
| Less than $10,000 | 8.3% | 5.9% | 4.9% |
| $10,000 to $14,999 | 5.8% | 4.0% | 3.6% |
| $15,000 to $24,999 | 9.8% | 7.8% | 6.6% |
| $25,000 to $34,999 | 9.5% | 8.0% | 6.8% |
| $35,000 to $49,999 | 14.3% | 12.3% | 10.4% |
| $50,000 to $74,999 | 17.0% | 17.2% | 15.7% |
| $75,000 to $99,999 | 12.4% | 12.9% | 12.7% |
| $100,000 to $149,999 | 12.1% | 16.1% | 17.4% |
| $150,000 to $199,999 | 5.3% | 7.5% | 9.3% |
| $200,000 or more | 5.4% | 8.3% | 12.6% |


