Bacliff SnackAbility
Overall SnackAbility
Cost of living in Bacliff summary. We use data on the cost of living to determine how expensive it is to live in Bacliff. Real estate prices drive most of the variance in cost of living around Texas. Key points include:
The cost of living in Bacliff is 95 with 100 being average.
The cost of living in Bacliff is 0.9x lower than the national average.
The median home value in Bacliff is $218,055.
The median income in Bacliff is $51,458.
Bacliff's Overall Cost Of Living
Lower Than The National Average
Cost Of Living In Bacliff Comparison Table
| Living Expense | Bacliff | Texas | National Average |
|---|---|---|---|
| Overall | 95 | 93 | 100 |
| Services | 97 | 100 | 100 |
| Groceries | 96 | 99 | 100 |
| Health | 87 | 81 | 100 |
| Housing | 98 | 97 | 100 |
| Transportation | 104 | 103 | 100 |
| Utilities | 100 | 100 | 100 |
Source: Cost of living index, normalized to US average = 100
Bacliff, TX Weather
The average high in Bacliff is 77.6° and the average low is 61.9°.
There are 69.0 days of precipitation each year.
Expect an average of 57.3 inches of precipitation each year with 0.1 inches of snow.
| Stat | Bacliff |
|---|---|
| Average Annual High | 77.6 |
| Average Annual Low | 61.9 |
| Annual Precipitation Days | 69.0 |
| Average Annual Precipitation | 57.3 |
| Average Annual Snowfall | 0.1 |
Average High
Days of Rain
Source: NOAA climate normals (30-year)
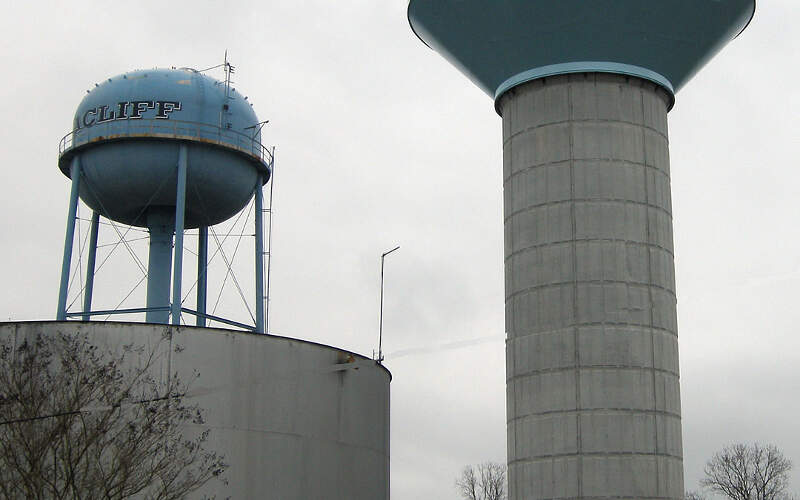
Bacliff, TX Photos

Rankings & Articles For Bacliff


Locations Around Bacliff
Map Of Bacliff, TX
Best Places Around Bacliff
Friendswood, TX
Population 41,030
Deer Park, TX
Population 33,967
La Porte, TX
Population 36,730
Seabrook, TX
Population 13,768
Dickinson, TX
Population 21,753
Santa Fe, TX
Population 12,901
South Houston, TX
Population 16,033
Webster, TX
Population 12,366
La Marque, TX
Population 19,268
Baytown, TX
Population 85,205
Bacliff Demographics And Statistics
Population over time in Bacliff
The current population in Bacliff is 9,541. The population has increased 31.1% from 2010.
| Year | Population | % Change |
|---|---|---|
| 2024 | 9,541 | -4.0% |
| 2023 | 9,935 | -3.7% |
| 2022 | 10,313 | -2.4% |
| 2021 | 10,567 | -8.2% |
| 2020 | 11,513 | 6.1% |
| 2019 | 10,856 | 1.9% |
| 2018 | 10,649 | -2.5% |
| 2017 | 10,925 | 21.3% |
| 2016 | 9,004 | 2.9% |
| 2015 | 8,753 | 1.7% |
| 2014 | 8,606 | 11.0% |
| 2013 | 7,750 | 2.3% |
| 2012 | 7,573 | 0.1% |
| 2011 | 7,568 | 4.0% |
| 2010 | 7,275 | - |
Race / Ethnicity in Bacliff
See the full breakdown
Bacliff is:
37.7% White with 3,598 White residents.
8.5% African American with 812 African American residents.
0.1% American Indian with 6 American Indian residents.
2.3% Asian with 216 Asian residents.
0.0% Hawaiian with 0 Hawaiian residents.
0.6% Other with 56 Other residents.
3.5% Two Or More with 334 Two Or More residents.
47.4% Hispanic with 4,519 Hispanic residents.
| Race | Bacliff | TX | USA |
|---|---|---|---|
| White | 37.7% | 39.1% | 57.4% |
| African American | 8.5% | 11.9% | 11.9% |
| American Indian | 0.1% | 0.1% | 0.5% |
| Asian | 2.3% | 5.5% | 5.9% |
| Hawaiian | 0.0% | 0.1% | 0.2% |
| Other | 0.6% | 0.4% | 0.6% |
| Two Or More | 3.5% | 3.1% | 4.3% |
| Hispanic | 47.4% | 39.7% | 19.3% |
Gender in Bacliff
See the full breakdown
Bacliff is 51.7% female with 4,933 female residents.
Bacliff is 48.3% male with 4,608 male residents.
| Gender | Bacliff | TX | USA |
|---|---|---|---|
| Female | 51.7% | 50.1% | 50.5% |
| Male | 48.3% | 49.9% | 49.5% |
Highest level of educational attainment in Bacliff for adults over 25
See the full breakdown
13.0% of adults in Bacliff completed < 9th grade.
8.0% of adults in Bacliff completed 9-12th grade.
22.0% of adults in Bacliff completed high school / ged.
25.0% of adults in Bacliff completed some college.
12.0% of adults in Bacliff completed associate's degree.
17.0% of adults in Bacliff completed bachelor's degree.
3.0% of adults in Bacliff completed master's degree.
0.0% of adults in Bacliff completed professional degree.
0.0% of adults in Bacliff completed doctorate degree.
| Education | Bacliff | TX | USA |
|---|---|---|---|
| < 9th Grade | 13.0% | 8.0% | 4.0% |
| 9-12th Grade | 8.0% | 7.0% | 6.0% |
| High School / GED | 22.0% | 24.0% | 26.0% |
| Some College | 25.0% | 20.0% | 19.0% |
| Associate's Degree | 12.0% | 8.0% | 9.0% |
| Bachelor's Degree | 17.0% | 21.0% | 22.0% |
| Master's Degree | 3.0% | 9.0% | 10.0% |
| Professional Degree | 0.0% | 2.0% | 2.0% |
| Doctorate Degree | 0.0% | 1.0% | 2.0% |
Household Income For Bacliff, Texas
See the full breakdown
10.3% of households in Bacliff earn Less than $10,000.
1.2% of households in Bacliff earn $10,000 to $14,999.
10.3% of households in Bacliff earn $15,000 to $24,999.
14.3% of households in Bacliff earn $25,000 to $34,999.
12.5% of households in Bacliff earn $35,000 to $49,999.
12.7% of households in Bacliff earn $50,000 to $74,999.
10.0% of households in Bacliff earn $75,000 to $99,999.
18.0% of households in Bacliff earn $100,000 to $149,999.
9.0% of households in Bacliff earn $150,000 to $199,999.
1.7% of households in Bacliff earn $200,000 or more.
| Income | Bacliff | TX | USA |
|---|---|---|---|
| Less than $10,000 | 10.3% | 5.0% | 5.0% |
| $10,000 to $14,999 | 1.2% | 3.3% | 3.4% |
| $15,000 to $24,999 | 10.3% | 6.3% | 6.3% |
| $25,000 to $34,999 | 14.3% | 6.8% | 6.6% |
| $35,000 to $49,999 | 12.5% | 10.5% | 10.1% |
| $50,000 to $74,999 | 12.7% | 16.1% | 15.5% |
| $75,000 to $99,999 | 10.0% | 12.8% | 12.6% |
| $100,000 to $149,999 | 18.0% | 17.3% | 17.5% |
| $150,000 to $199,999 | 9.0% | 9.5% | 9.6% |
| $200,000 or more | 1.7% | 12.5% | 13.4% |
Source: U.S. Census ACS 5-year estimates (2024)


