Brownsville, TX
Demographics And Statistics
Living In Brownsville, Texas Summary
Life in Brownsville research summary. HomeSnacks has been using Saturday Night Science to research the quality of life in Brownsville over the past nine years using Census, FBI, Zillow, and other primary data sources. Based on the most recently available data, we found the following about life in Brownsville:
The population in Brownsville is 188,023.
The median home value in Brownsville is $190,038.
The median income in Brownsville is $48,675.
The cost of living in Brownsville is 78 which is 0.8x lower than the national average.
The median rent in Brownsville is $906.
The unemployment rate in Brownsville is 6.1%.
The poverty rate in Brownsville is 24.9%.
The average high in Brownsville is 83.6° and the average low is 64.8°.
Brownsville SnackAbility
Overall SnackAbility
Brownsville, TX Crime Report
Crime in Brownsville summary. We use data from the FBI to determine the crime rates in Brownsville. Key points include:
There were 4,585 total crimes in Brownsville in the last reporting year.
The overall crime rate per 100,000 people in Brownsville is 2,397.7 / 100k people.
The violent crime rate per 100,000 people in Brownsville is 456.0 / 100k people.
The property crime rate per 100,000 people in Brownsville is 1,941.7 / 100k people.
Overall, crime in Brownsville is 13.14% above the national average.
Total Crimes
Above National Average
Crime In Brownsville Comparison Table
| Statistic | Count Raw |
Brownsville / 100k People |
Texas / 100k People |
National / 100k People |
|---|---|---|---|---|
| Total Crimes Per 100K | 4,585 | 2,397.7 | 2,429.9 | 2,119.2 |
| Violent Crime | 872 | 456.0 | 389.4 | 359.0 |
| Murder | 4 | 2.1 | 5.2 | 5.0 |
| Robbery | 116 | 60.7 | 63.5 | 61.0 |
| Aggravated Assault | 693 | 362.4 | 270.7 | 256.0 |
| Property Crime | 3,713 | 1,941.7 | 2,040.5 | 1,760.0 |
| Burglary | 368 | 192.4 | 284.3 | 229.0 |
| Larceny | 2,554 | 1,335.6 | 1,425.6 | 1,272.0 |
| Car Theft | 791 | 413.7 | 330.7 | 259.0 |
Brownsville, TX Cost Of Living
Cost of living in Brownsville summary. We use data on the cost of living to determine how expensive it is to live in Brownsville. Real estate prices drive most of the variance in cost of living around Texas. Key points include:
The cost of living in Brownsville is 78 with 100 being average.
The cost of living in Brownsville is 0.8x lower than the national average.
The median home value in Brownsville is $190,038.
The median income in Brownsville is $48,675.
Brownsville's Overall Cost Of Living
Lower Than The National Average
Cost Of Living In Brownsville Comparison Table
| Living Expense | Brownsville | Texas | National Average | |
|---|---|---|---|---|
| Overall | 78 | 92 | 100 | |
| Services | 76 | 97 | 100 | |
| Groceries | 94 | 97 | 100 | |
| Health | 83 | 93 | 100 | |
| Housing | 58 | 82 | 100 | |
| Transportation | 84 | 94 | 100 | |
| Utilities | 102 | 104 | 100 | |
Brownsville, TX Weather
The average high in Brownsville is 83.6° and the average low is 64.8°.
There are 38.9 days of precipitation each year.
Expect an average of 27.0 inches of precipitation each year with 0.0 inches of snow.
| Stat | Brownsville |
|---|---|
| Average Annual High | 83.6 |
| Average Annual Low | 64.8 |
| Annual Precipitation Days | 38.9 |
| Average Annual Precipitation | 27.0 |
| Average Annual Snowfall | 0.0 |
Average High
Days of Rain
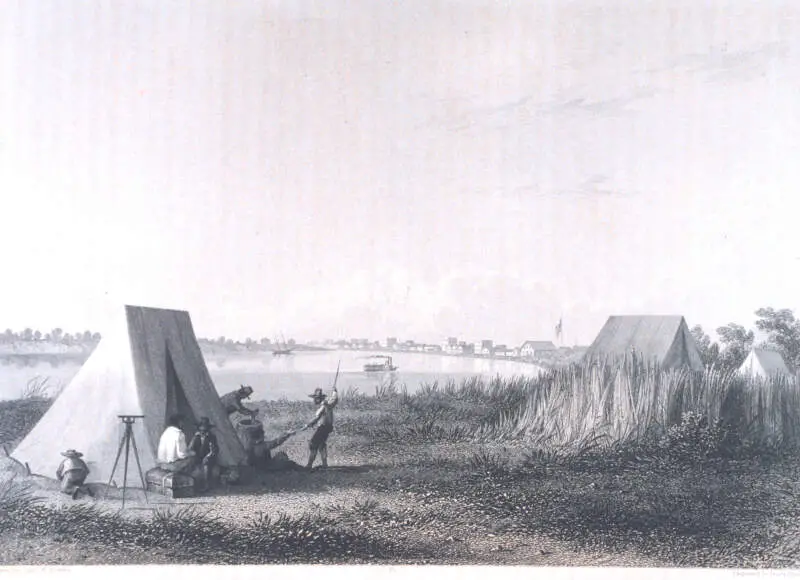
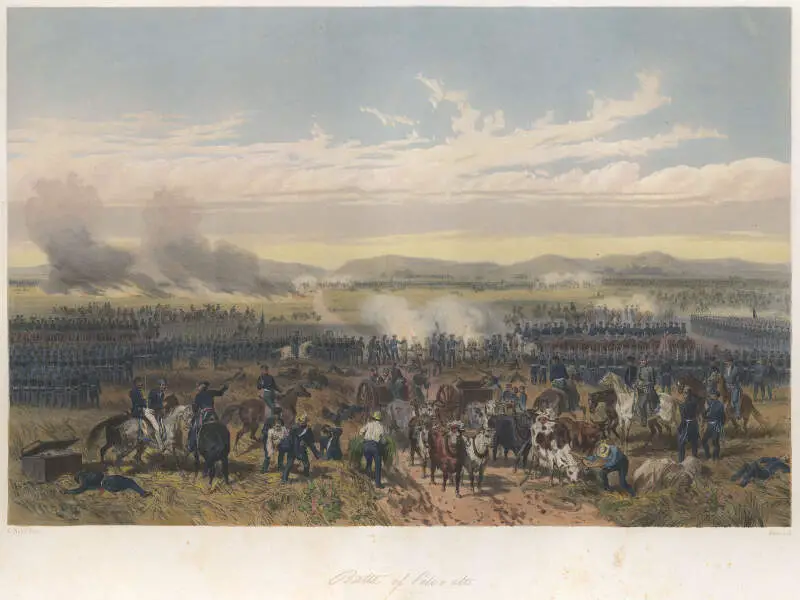
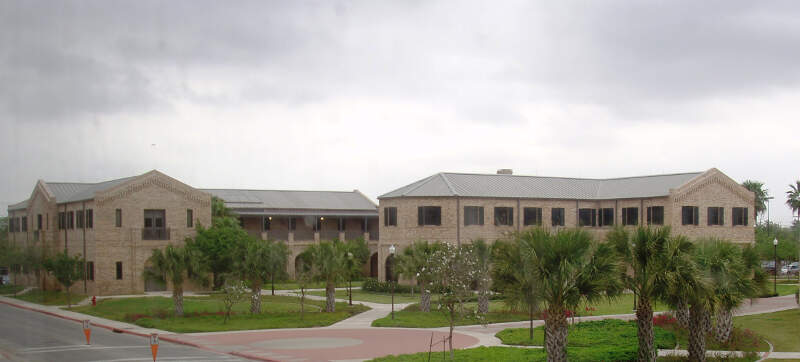
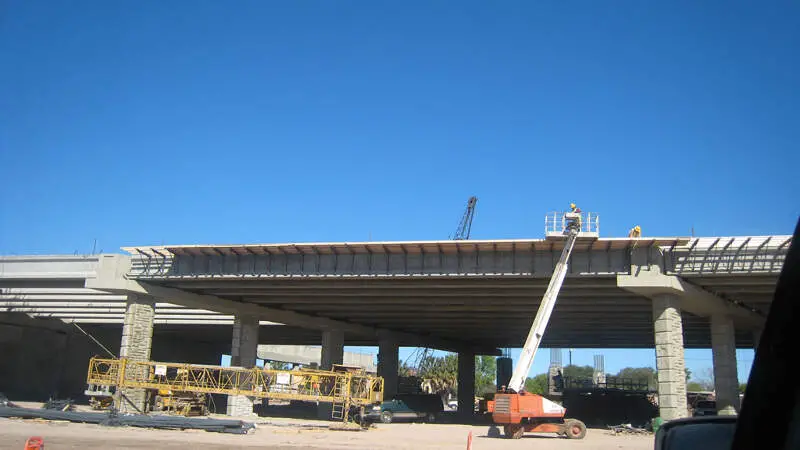
Brownsville, TX Photos
1 Reviews & Comments About Brownsville
/5

Rolando Arriazola - None
I'm from Brownsville and Google doesn't show all the taco trucks parked at the swap meet and the bright side is that we have Padre island a beautiful island beach too cool off
Rankings for Brownsville in Texas


Locations Around Brownsville
Map Of Brownsville, TX
Best Places Around Brownsville
Edinburg, TX
Population 102,561
Raymondville, TX
Population 10,243
Pharr, TX
Population 79,809
San Benito, TX
Population 24,677
Harlingen, TX
Population 71,669
Alamo, TX
Population 20,008
Weslaco, TX
Population 41,437
Mercedes, TX
Population 16,449
Donna, TX
Population 16,774
Brownsville Demographics And Statistics
Population over time in Brownsville
The current population in Brownsville is 188,023. The population has increased 10.9% from 2010.
| Year | Population | % Change |
|---|---|---|
| 2023 | 188,023 | 0.5% |
| 2022 | 186,999 | 0.6% |
| 2021 | 185,849 | 2.0% |
| 2020 | 182,230 | -0.0% |
| 2019 | 182,271 | -0.2% |
| 2018 | 182,679 | 0.3% |
| 2017 | 182,083 | -0.0% |
| 2016 | 182,110 | 0.3% |
| 2015 | 181,487 | 0.9% |
| 2014 | 179,834 | 1.1% |
| 2013 | 177,795 | 1.5% |
| 2012 | 175,210 | 1.6% |
| 2011 | 172,491 | 1.7% |
| 2010 | 169,599 | - |
Race / Ethnicity in Brownsville
Brownsville is:
4.2% White with 7,971 White residents.
0.3% African American with 498 African American residents.
0.1% American Indian with 106 American Indian residents.
0.8% Asian with 1,541 Asian residents.
0.0% Hawaiian with 25 Hawaiian residents.
0.1% Other with 230 Other residents.
0.3% Two Or More with 506 Two Or More residents.
94.2% Hispanic with 177,146 Hispanic residents.
| Race | Brownsville | TX | USA |
|---|---|---|---|
| White | 4.2% | 39.9% | 58.2% |
| African American | 0.3% | 11.9% | 12.0% |
| American Indian | 0.1% | 0.2% | 0.5% |
| Asian | 0.8% | 5.3% | 5.7% |
| Hawaiian | 0.0% | 0.1% | 0.2% |
| Other | 0.1% | 0.4% | 0.5% |
| Two Or More | 0.3% | 2.9% | 3.9% |
| Hispanic | 94.2% | 39.5% | 19.0% |
Gender in Brownsville
Brownsville is 51.8% female with 97,401 female residents.
Brownsville is 48.2% male with 90,622 male residents.
| Gender | Brownsville | TX | USA |
|---|---|---|---|
| Female | 51.8% | 50.1% | 50.5% |
| Male | 48.2% | 49.9% | 49.5% |
Highest level of educational attainment in Brownsville for adults over 25
18.0% of adults in Brownsville completed < 9th grade.
12.0% of adults in Brownsville completed 9-12th grade.
25.0% of adults in Brownsville completed high school / ged.
16.0% of adults in Brownsville completed some college.
7.0% of adults in Brownsville completed associate's degree.
16.0% of adults in Brownsville completed bachelor's degree.
5.0% of adults in Brownsville completed master's degree.
1.0% of adults in Brownsville completed professional degree.
0.0% of adults in Brownsville completed doctorate degree.
| Education | Brownsville | TX | USA |
|---|---|---|---|
| < 9th Grade | 18.0% | 7.0% | 5.0% |
| 9-12th Grade | 12.0% | 7.0% | 6.0% |
| High School / GED | 25.0% | 24.0% | 26.0% |
| Some College | 16.0% | 21.0% | 19.0% |
| Associate's Degree | 7.0% | 8.0% | 9.0% |
| Bachelor's Degree | 16.0% | 21.0% | 21.0% |
| Master's Degree | 5.0% | 9.0% | 10.0% |
| Professional Degree | 1.0% | 2.0% | 2.0% |
| Doctorate Degree | 0.0% | 1.0% | 2.0% |
Household Income For Brownsville, Texas
8.0% of households in Brownsville earn Less than $10,000.
7.3% of households in Brownsville earn $10,000 to $14,999.
11.9% of households in Brownsville earn $15,000 to $24,999.
10.2% of households in Brownsville earn $25,000 to $34,999.
13.6% of households in Brownsville earn $35,000 to $49,999.
16.2% of households in Brownsville earn $50,000 to $74,999.
12.5% of households in Brownsville earn $75,000 to $99,999.
11.9% of households in Brownsville earn $100,000 to $149,999.
5.3% of households in Brownsville earn $150,000 to $199,999.
3.0% of households in Brownsville earn $200,000 or more.
| Income | Brownsville | TX | USA |
|---|---|---|---|
| Less than $10,000 | 8.0% | 5.0% | 4.9% |
| $10,000 to $14,999 | 7.3% | 3.4% | 3.6% |
| $15,000 to $24,999 | 11.9% | 6.5% | 6.6% |
| $25,000 to $34,999 | 10.2% | 7.0% | 6.8% |
| $35,000 to $49,999 | 13.6% | 10.9% | 10.4% |
| $50,000 to $74,999 | 16.2% | 16.4% | 15.7% |
| $75,000 to $99,999 | 12.5% | 12.8% | 12.7% |
| $100,000 to $149,999 | 11.9% | 17.2% | 17.4% |
| $150,000 to $199,999 | 5.3% | 9.1% | 9.3% |
| $200,000 or more | 3.0% | 11.7% | 12.6% |


