Cleveland SnackAbility
Overall SnackAbility
Crime in Cleveland summary. We use data from the FBI to determine the crime rates in Cleveland. Key points include:
There were 239 total crimes in Cleveland in the last reporting year.
The overall crime rate per 100,000 people in Cleveland is 2,459.4 / 100k people.
The violent crime rate per 100,000 people in Cleveland is 483.6 / 100k people.
The property crime rate per 100,000 people in Cleveland is 1,975.7 / 100k people.
Overall, crime in Cleveland is 16.05% above the national average.
Total Crimes
Above National Average
Crime In Cleveland Comparison Table
| Statistic | Count Raw |
Cleveland / 100k People |
Texas / 100k People |
National / 100k People |
|---|---|---|---|---|
| Total Crimes Per 100K | 239 | 2,459.4 | 2,429.9 | 2,119.2 |
| Violent Crime | 47 | 483.6 | 389.4 | 359.0 |
| Murder | 0 | 0.0 | 5.2 | 5.0 |
| Robbery | 6 | 61.7 | 63.5 | 61.0 |
| Aggravated Assault | 37 | 380.7 | 270.7 | 256.0 |
| Property Crime | 192 | 1,975.7 | 2,040.5 | 1,760.0 |
| Burglary | 25 | 257.3 | 284.3 | 229.0 |
| Larceny | 151 | 1,553.8 | 1,425.6 | 1,272.0 |
| Car Theft | 16 | 164.6 | 330.7 | 259.0 |
Source: FBI Uniform Crime Reporting (2024)
Cost of living in Cleveland summary. We use data on the cost of living to determine how expensive it is to live in Cleveland. Real estate prices drive most of the variance in cost of living around Texas. Key points include:
The cost of living in Cleveland is 87 with 100 being average.
The cost of living in Cleveland is 0.9x lower than the national average.
The median home value in Cleveland is $233,636.
The median income in Cleveland is $54,519.
Cleveland's Overall Cost Of Living
Lower Than The National Average
Cost Of Living In Cleveland Comparison Table
| Living Expense | Cleveland | Texas | National Average |
|---|---|---|---|
| Overall | 87 | 93 | 100 |
| Services | 99 | 100 | 100 |
| Groceries | 99 | 99 | 100 |
| Health | 62 | 81 | 100 |
| Housing | 94 | 97 | 100 |
| Transportation | 108 | 103 | 100 |
| Utilities | 101 | 100 | 100 |
Source: Cost of living index, normalized to US average = 100
Cleveland, TX Weather
The average high in Cleveland is 78.2° and the average low is 57.0°.
There are 70.4 days of precipitation each year.
Expect an average of 53.7 inches of precipitation each year with 0.1 inches of snow.
| Stat | Cleveland |
|---|---|
| Average Annual High | 78.2 |
| Average Annual Low | 57.0 |
| Annual Precipitation Days | 70.4 |
| Average Annual Precipitation | 53.7 |
| Average Annual Snowfall | 0.1 |
Average High
Days of Rain
Source: NOAA climate normals (30-year)
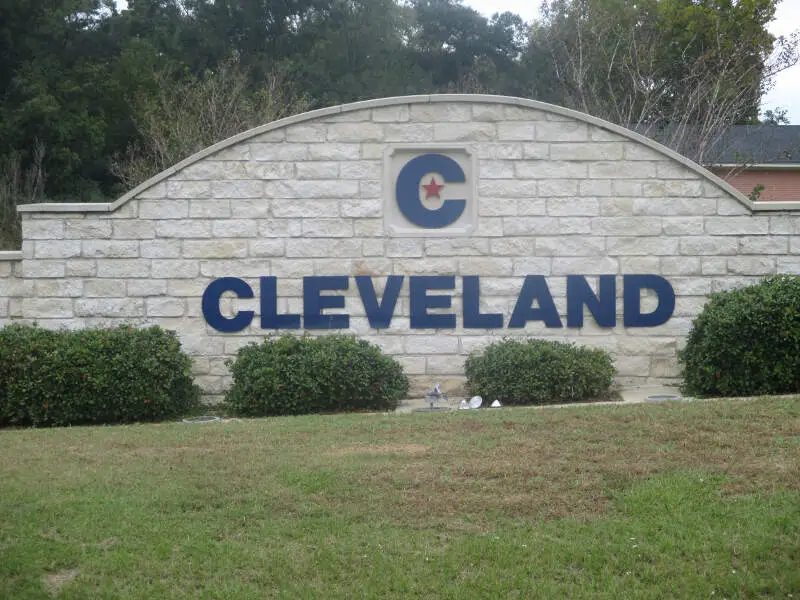
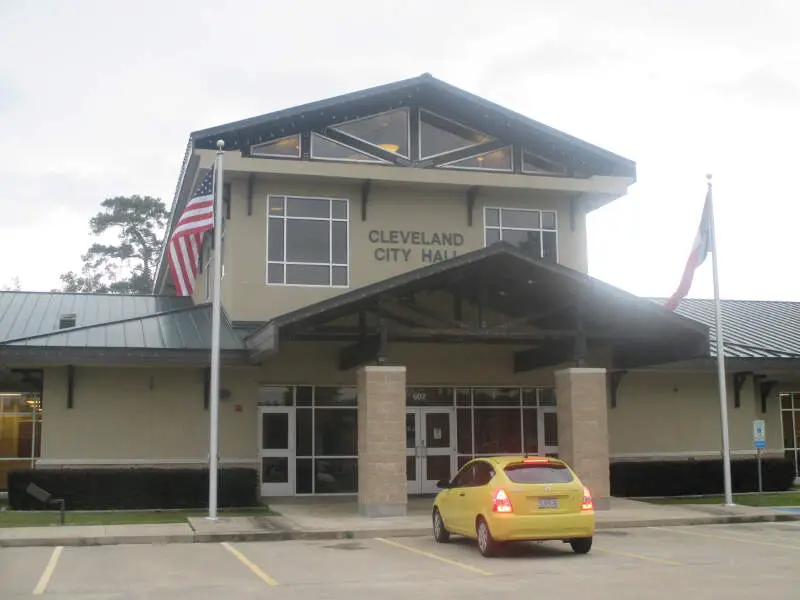
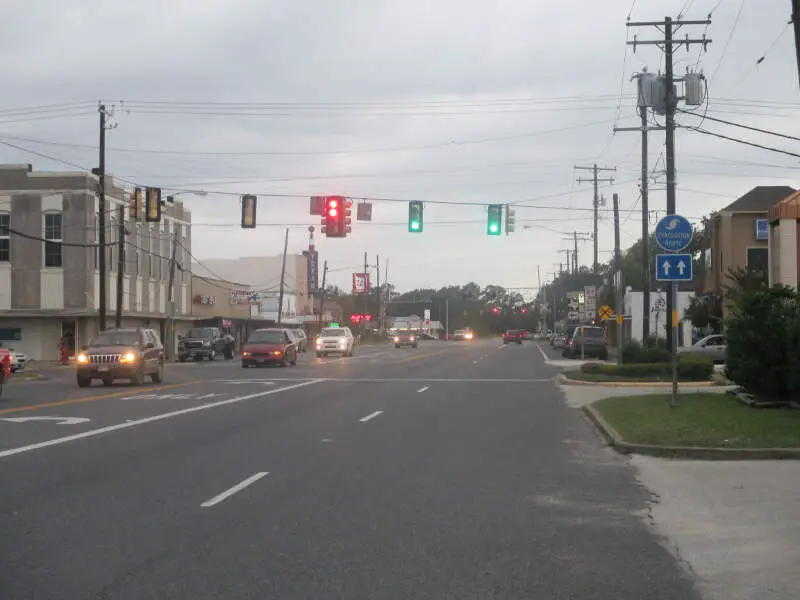
Cleveland, TX Photos

2 Reviews & Comments About Cleveland

Staying in a hotel while working in Cleveland. Went for a jog in the surrounding neighborhood. I have a habit of smiling and nodding/waving at people I run buy and nobody returned the gesture. In fact, numerous people "mad-dogged" me and 1 guy standing on a corner actually made me fear for my safety because of the intense glare he gave me for perhaps 200 yards. I have met friendly wait staff at the restaurants and hotels here but for the most part, this is not a friendly place.
And yes, I am very familiar with small town Texas. There is no charm here.
Good: most restaurants I have been to here have been decent with friendly wait staff.
Bad: Just about everyone I came across to out and about in town.
The schoool is bad over all but there ain't much crime here unless u live in the south by plum grove where a lot of ppl are staring to move in and if u live over there everything is far from u 15 min drive just for a grocery shopping but honestly Cleveland s***s
Bad small town ppl talk
Good non
Rankings & Articles For Cleveland


Locations Around Cleveland
Map Of Cleveland, TX
Best Places Around Cleveland
West University Place, TX
Population 14,982
Bellaire, TX
Population 17,206
Deer Park, TX
Population 33,967
Atascocita, TX
Population 99,354
The Woodlands, TX
Population 121,002
Galena Park, TX
Population 10,487
Spring, TX
Population 68,580
La Porte, TX
Population 36,730
Channelview, TX
Population 43,605
Cloverleaf, TX
Population 24,063
Cleveland Demographics And Statistics
Population over time in Cleveland
The current population in Cleveland is 8,984. The population has increased 14.7% from 2010.
| Year | Population | % Change |
|---|---|---|
| 2024 | 8,984 | 10.4% |
| 2023 | 8,137 | 4.9% |
| 2022 | 7,756 | 3.2% |
| 2021 | 7,515 | -7.8% |
| 2020 | 8,150 | 1.1% |
| 2019 | 8,061 | 0.8% |
| 2018 | 7,998 | 1.2% |
| 2017 | 7,904 | 0.3% |
| 2016 | 7,879 | 2.0% |
| 2015 | 7,728 | 0.6% |
| 2014 | 7,684 | 0.2% |
| 2013 | 7,671 | -0.5% |
| 2012 | 7,708 | -0.7% |
| 2011 | 7,765 | -0.9% |
| 2010 | 7,833 | - |
Race / Ethnicity in Cleveland
See the full breakdown
Cleveland is:
37.2% White with 3,340 White residents.
27.9% African American with 2,507 African American residents.
0.0% American Indian with 0 American Indian residents.
0.5% Asian with 45 Asian residents.
0.1% Hawaiian with 11 Hawaiian residents.
0.0% Other with 0 Other residents.
0.9% Two Or More with 84 Two Or More residents.
33.4% Hispanic with 2,997 Hispanic residents.
| Race | Cleveland | TX | USA |
|---|---|---|---|
| White | 37.2% | 39.1% | 57.4% |
| African American | 27.9% | 11.9% | 11.9% |
| American Indian | 0.0% | 0.1% | 0.5% |
| Asian | 0.5% | 5.5% | 5.9% |
| Hawaiian | 0.1% | 0.1% | 0.2% |
| Other | 0.0% | 0.4% | 0.6% |
| Two Or More | 0.9% | 3.1% | 4.3% |
| Hispanic | 33.4% | 39.7% | 19.3% |
Gender in Cleveland
See the full breakdown
Cleveland is 41.3% female with 3,707 female residents.
Cleveland is 58.7% male with 5,276 male residents.
| Gender | Cleveland | TX | USA |
|---|---|---|---|
| Female | 41.3% | 50.1% | 50.5% |
| Male | 58.7% | 49.9% | 49.5% |
Highest level of educational attainment in Cleveland for adults over 25
See the full breakdown
7.0% of adults in Cleveland completed < 9th grade.
11.0% of adults in Cleveland completed 9-12th grade.
43.0% of adults in Cleveland completed high school / ged.
23.0% of adults in Cleveland completed some college.
7.0% of adults in Cleveland completed associate's degree.
4.0% of adults in Cleveland completed bachelor's degree.
5.0% of adults in Cleveland completed master's degree.
0.0% of adults in Cleveland completed professional degree.
0.0% of adults in Cleveland completed doctorate degree.
| Education | Cleveland | TX | USA |
|---|---|---|---|
| < 9th Grade | 7.0% | 8.0% | 4.0% |
| 9-12th Grade | 11.0% | 7.0% | 6.0% |
| High School / GED | 43.0% | 24.0% | 26.0% |
| Some College | 23.0% | 20.0% | 19.0% |
| Associate's Degree | 7.0% | 8.0% | 9.0% |
| Bachelor's Degree | 4.0% | 21.0% | 22.0% |
| Master's Degree | 5.0% | 9.0% | 10.0% |
| Professional Degree | 0.0% | 2.0% | 2.0% |
| Doctorate Degree | 0.0% | 1.0% | 2.0% |
Household Income For Cleveland, Texas
See the full breakdown
8.4% of households in Cleveland earn Less than $10,000.
3.3% of households in Cleveland earn $10,000 to $14,999.
9.8% of households in Cleveland earn $15,000 to $24,999.
7.1% of households in Cleveland earn $25,000 to $34,999.
18.6% of households in Cleveland earn $35,000 to $49,999.
18.2% of households in Cleveland earn $50,000 to $74,999.
9.6% of households in Cleveland earn $75,000 to $99,999.
9.6% of households in Cleveland earn $100,000 to $149,999.
9.0% of households in Cleveland earn $150,000 to $199,999.
6.5% of households in Cleveland earn $200,000 or more.
| Income | Cleveland | TX | USA |
|---|---|---|---|
| Less than $10,000 | 8.4% | 5.0% | 5.0% |
| $10,000 to $14,999 | 3.3% | 3.3% | 3.4% |
| $15,000 to $24,999 | 9.8% | 6.3% | 6.3% |
| $25,000 to $34,999 | 7.1% | 6.8% | 6.6% |
| $35,000 to $49,999 | 18.6% | 10.5% | 10.1% |
| $50,000 to $74,999 | 18.2% | 16.1% | 15.5% |
| $75,000 to $99,999 | 9.6% | 12.8% | 12.6% |
| $100,000 to $149,999 | 9.6% | 17.3% | 17.5% |
| $150,000 to $199,999 | 9.0% | 9.5% | 9.6% |
| $200,000 or more | 6.5% | 12.5% | 13.4% |
Source: U.S. Census ACS 5-year estimates (2024)


